Stanford Vis Group: Protovis
- Last Updated: 11/20/2014 12:00:00 AM
- Site: http://mbostock.github.io/protovis/
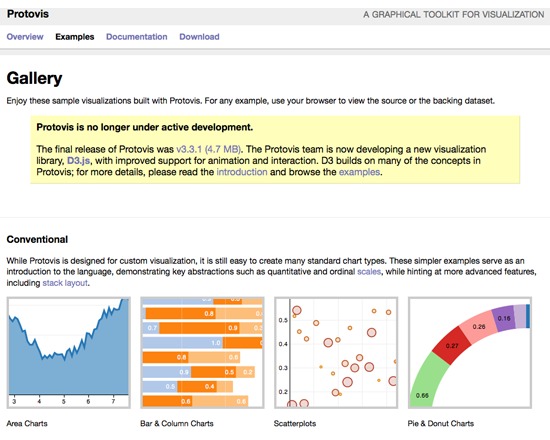
Protovis is a free, open source tool for composing custom views of data from simple elements such as bars or dots. Marks are defined through dynamic properties to allow inheritance, scales and layouts for simplified visualization construction. This tool uses JavaScript and SVG in order to ensure web-native visualizations. Protovis is no longer under active construction; many of the concepts used in its development have been implemented in its successor, D3.js.
Documentation
Creator(s): Stanford Visualization Group
Creator's Site: http://vis.stanford.edu/
Creator's Email:
Repository:
Attributes
- Type of analysis: Visualization Analysis
- Type of license: Free Open Source
- Web Usable: Software you Download and Install
- Ease of Use: Moderate
- TaDiRAH Goals: Analysis
- TaDiRAH Methods: Visualization
List this tool appear on
Rating
Suggested Tools
Comments
ProtoVis also appears in Project Bamboo's DiRT, a registry of digital tools suitable for academic research. DiRT contains a wide range of tools and software searchable by task, such as annotation, content management, collaborative research, or authoring. It is an excellent resource for Digital Humanists seeking the right tool for the task at hand.
View ProtoVis in DiRT:
http://dirt.projectbamboo.org/resources/protovis
View the full site:
http://dirt.projectbamboo.org/
Protovis was used in this research abstract available in XML format https://raw.githubusercontent.com/lehkost/ToolXtractor/master/data/xml/2015/WILSON_Emma_Annette_Building_The_Early_Modern_Digital_U.xml