Visual Browser
- Last Updated: 10/26/2018 12:00:00 AM
- Site: http://nlp.fi.muni.cz/projekty/visualbrowser
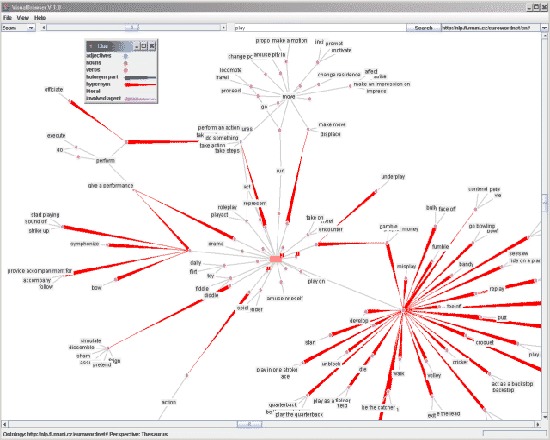
Visual Browser is a Java application for visualizing RDF data using the Jena framework. The resultant graphs are animated and permit users to expand and hide nodes and switch the view of edges, allowing them to focus on a small part of the network. The visualization engine is derived from TouchGraph LLC and follows the navigation approach of WebOFDAV, a system based on the concept of exploratory navigation to reduce chances of getting “lost in hyperspace” situation.
Documentation
Creator(s): Masaryk University Natural Language Processing Centre
Creator's Site: http://nlp.fi.muni.cz/
Creator's Email: xpopelk@fi.muni.cz
Repository:
Attributes
- Type of analysis: Visualization RDF Analysis
- Type of license: Free Open Source
- Background Processing: Not Applicable
- Web Usable: Software you Download and Install
- Ease of Use: Easy
- Usage: Widely Used
- TaDiRAH Goals: Analysis
- TaDiRAH Methods: Other (analysis) Visualization
List this tool appear on
Rating
Suggested Tools
Comments
Visual Browser is a free tool developed by Masaryk University Natural Language Processing Centre with the goal to visualize the data in RDF scheme. The software is provided under NLP Centre Web Services Licence and GNU GPL Licence version 2. One can download the source codes after requesting the password from Masaryk University representative.
Visual Browser can be operated very easily in Java command line. Important note to keep in mind is that it requires Jena framework to obtain the data. Developers explain that this integration gives possibility for saving RDF in various formats, for instance XML file or relational database. Besides packaged version there is Visual Browser Mini that works as a Java Applet directly from the web browser. A very useful feature of the tool is an option to load own data from file, a database (MySQL and Postgre SQL) or an URL.
The tool’s visualization uses the methods of animated expansions. Users can expand and hide nodes, switch the view of edges. Visual Browser’s visualization engine is powered by TouchGraph LLC and supports navigation approach of WebOFDAV. The user interface is pretty simple which makes it very easy to work with visualization. Such functions available within the user interface as View the labels, history and clue make Visual Browser a good tool for getting statistics about the data, for example by clicking Display clue one can see many important characteristics of the data – the form of the word, its functions, the literal, involved agent etc. The graphs provided by Visual Browser are animated containing the fixed points (nodes) and elastic connections (edges). This feature is good in case a user wants to focus on a specific part of the network or research a particular issue in the context of the whole data.
Visual Browser was mentioned in this research abstract available in XML format https://raw.githubusercontent.com/lehkost/ToolXtractor/master/data/xml/2015/SIMPSON_John_Edward_Building_Better_Linked_Data___Ontol.xml