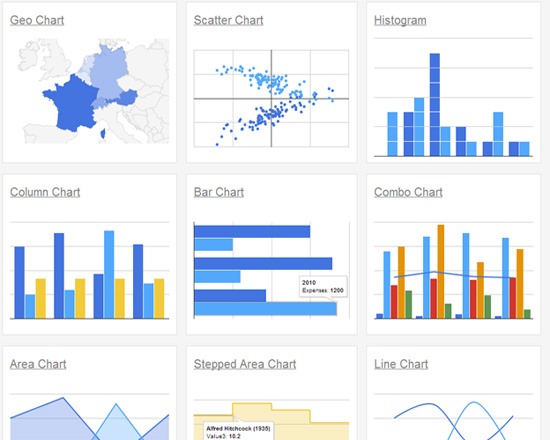
Google Charts
- Last Updated: 10/5/2018 12:00:00 AM
- Site: https://developers.google.com/chart/
Google Charts (formerly the Google Visualization API) is a web-based interface for interactive data visualization via HTML5 and SVG. It includes a number of preset chart types ranging from line charts to word trees and all are customizable. A separate selection of user community contributed chart types is also available. Within a chart, the API identifies events that users can trigger with presets ranging from simple clicks to Javascript methods, and enable users to construct chart dashboards that can be embedded in their website along with the chart proper.
Documentation
Creator(s): Google Developers
Creator's Site: https://developers.google.com/
Creator's Email:
Repository:
Attributes
- Type of analysis: Visualization Analysis
- Type of license: Free Open Source
- Web Usable: Run in Browser
- Ease of Use: Easy
- Usage: Popular
- TaDiRAH Goals: Analysis
- TaDiRAH Methods: Other (analysis) Statistical Analysis Visualization
List this tool appear on
Rating
Suggested Tools
Comments
Google Charts can also be used to handle RDF data. The Data-gov Wiki from the Rensselaer Polytechnic Institute has provided a tutorial for converting CSV data to RDF and then use Google Charts to visualize it at http://data-gov.tw.rpi.edu/wiki/How_to_use_Google_Visualization_API
Data-gov has also made nearly 300 RDF datasets available for wide use, which may be found at http://data-gov.tw.rpi.edu/wiki/Data.gov_Catalog
A post on how to create a viz app using Google Chart API and AngularJS: http://www.sitepoint.com/creating-visualization-app-using-google-charts-api-angularjs/