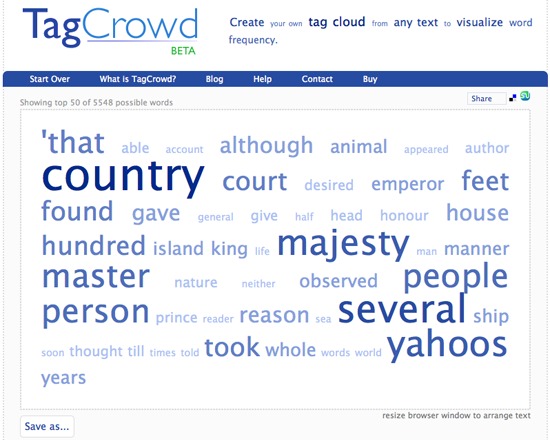
TagCrowd is a tool for generating a frequency-based word cloud from a source text, with a free browser version available through the TagCrowd website. A commercial version may also be purchased, subject to a creative commons license.
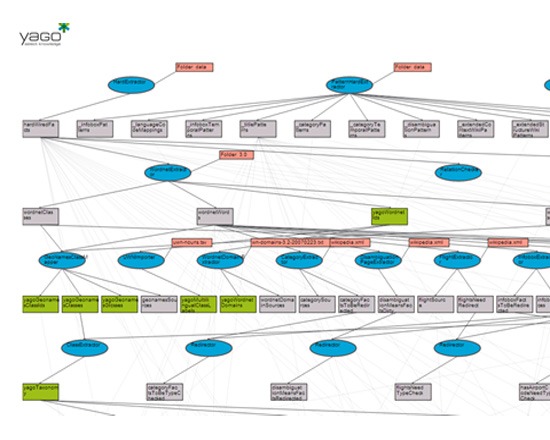
YAGO is a semantic knowledge base of over 10 million entities, and over 120 million facts about those entities, developed by the Max Planck Institut Informatik. Its base derives from Wikipedia, WordNet and GeoNames, and the accuaracy has not only been manually evaluated, but relations are also provided with an annotation stating its confidence value. The YAGO ontology includes spacial and temporal dimensions, and integrates WordNet's thematic domains as well. It can be queried or browsed right from the website, and the full ontology is available for download.
RAW is a free, open-source web application for creating visualizations that can be exported in SVG or PNG format and embedded into a website. Users can upload data with RAW's web interface and generate a variety of vector-based visualizations. RAW uses the D3.js library, and is maintained by the Density Design research studio at Polaitecnico di Milano.
nodegoat creates visualizations and provides a graphical user interface for the maintenance of data. It combines a variety of data management functions into one program.
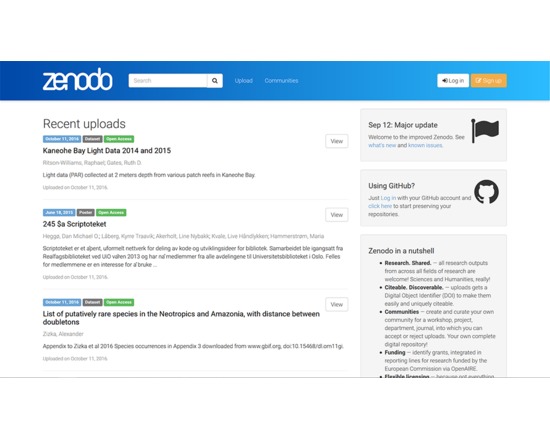
Zenodo is a catch-all repository for research data. It accepts all research data, with no requirements on format, size, access restrictions, or license. It is intended to support storage, curation, and publication of big research data. It was developed by the OpenAIRE partner CERN, responding to a request by the European Commission to create an open catch-all repository for all EC funded research.
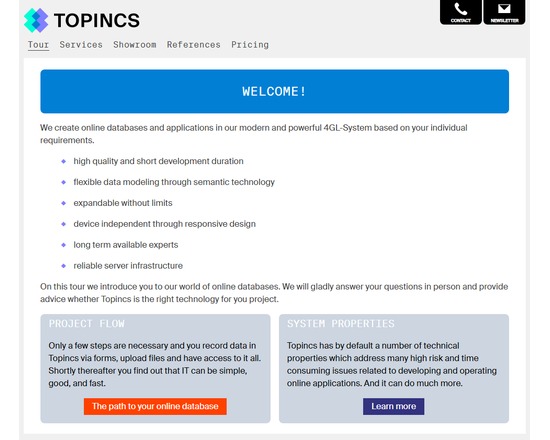
Topincs is a online database software. Given a data model, it allows data to be recorded and files to be uploaded and annotated through forms, data and files to be displayed and navigated through interconnected data sheets, and all that searched in the index. It overcomes the rigidity of relational databases by using semantic technology. In the simplest use case, a group of users can collaboratively edit information and upload files from any device with a web browser and an internet connection. Development time ranges between 1 and 8 hours.
By designing and implementing services, the data can be manipulated, transformed and aggregated through an virtual object oriented programming interface driven by the data model. This allows sophisticated use cases where different user groups with different rights are presented a completely different application working on the same database. In these cases development time ranges between 2 and 20 days.
A Topincs online database can be rented for a monthly fee. Topincs provide all services related to an online database: data modeling, programming, and support. They have special rates for educational institutions. Topincs can also be used as a Platform as a Service where the dark art of Topincs modeling and development must be studied online. The underlying semantic technology, Topic Maps, is taught there through hands on examples and will change your view on information technology.
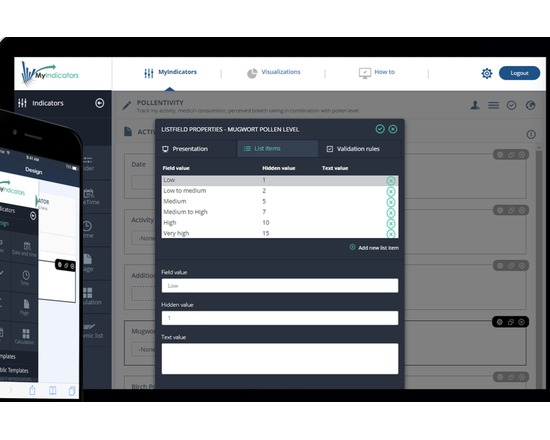
MyIndicators (http://myindicators.net/) is a digital, easy-to-use tool allows researchers, educators, students or anyone, to build their own tailored indicators (e.g. goals, strategies, parameters, survey, questions, calories intakes, alcohol consumptions or quantified self in terms of training, mood tracking or sleeping quality etc.)
The tool can be used for data collection, data storage, data analysis, data visualisation and export data (excel spreadsheet format). Easier to detect the trend and keep track based on the visualisation and using real time data.
There are free useful ready-made templates available for personal use. Besides research, education and quality industries, MyIndicators can be used by anyone who wishes to improve performance, achieve personal goals, promote healthy habits or gain personal insights. Educational and students discounts are available.
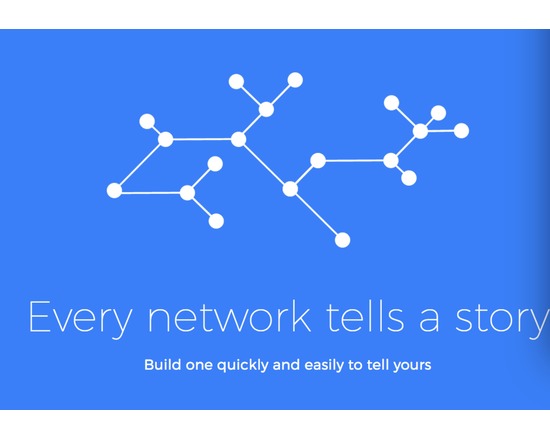
Onodo is a user friendly tool for doing basic visualisation and analysis within a browser making it cross-platform right out of the box. Data can be entered via their intuitive, in-browser node and edge creation tables or imported from a file. As data is added it is instantly previewed and displayed. The visual appearance can be tweaked on the fly and customised in a variety of ways (including applying a unique image or URL to each node). Once created, visualisations can be embedded and shared outside of the Onodo browser environment. Moreover, with a click of a button, Onodo calculates standard network parameters such as betweenness, closeness and displays these values within the table. It calculates and demonstrates basic network parameters and measures quickly and allows for the creation of chapters that cement using the visualisation as a data-driven narrative device.
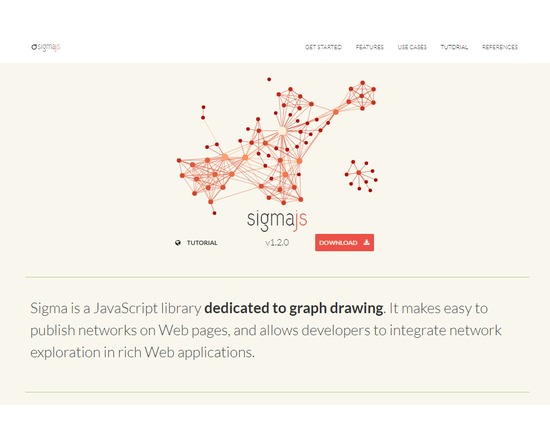
Sigma is a JavaScript library dedicated to graph drawing. It makes it easy to publish networks on Web pages, and allows developers to integrate network exploration in rich Web applications.
It is highly interactive and allows a researcher to extend their work from a dedicated graph analysis package such as Gephi and share it via the web to allow for communication of research outputs, while permitting viewers to explore and discover their own findings from the raw graph network.
Lucidpress is a free online editor for making pamphlets, brochures, flyers, magazines, and more. Features include real-time collaboration, digital publishing, and easy sharing, all of which come in an intuitive, drag-and-drop interface. Upgrade to a professional account for increased storage space and access to additional templates.