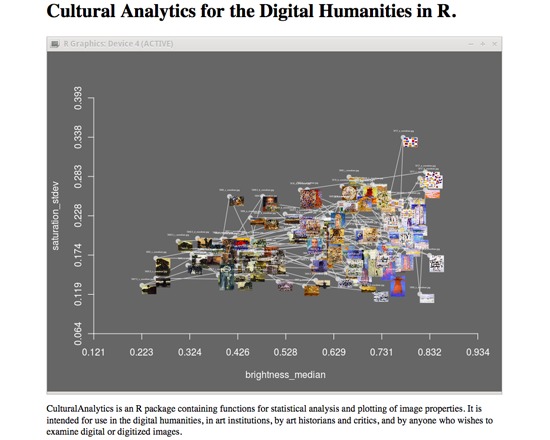
CulturalAnalytics, also known as Cultural Analytics for the Digital Humanities in R, is a free R package of functions for statistical analysis and plotting image properties, developed by Rob Myers specifically for the Digital Humanities, and of value to anyone else with an interest in examining digital or digitized images. It includes statistical functions and can generate histograms, colour clouds, image scatter charts and more.
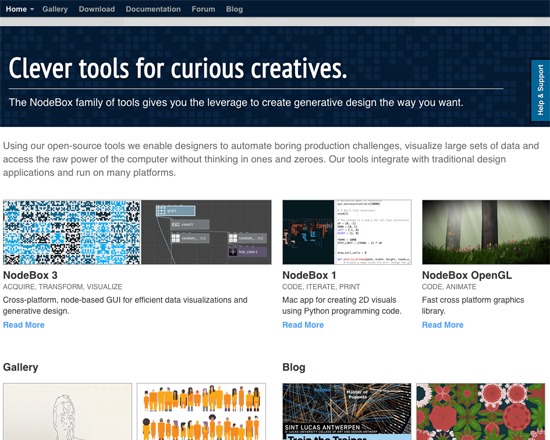
NodeBox is an open-source package of tools that includes the capacity to visualize large data sets. It utilizes interconnected nodes to generate and manipulate data visualizations, and can import data either from common programs such as Excel, or from custom user-developed importers.
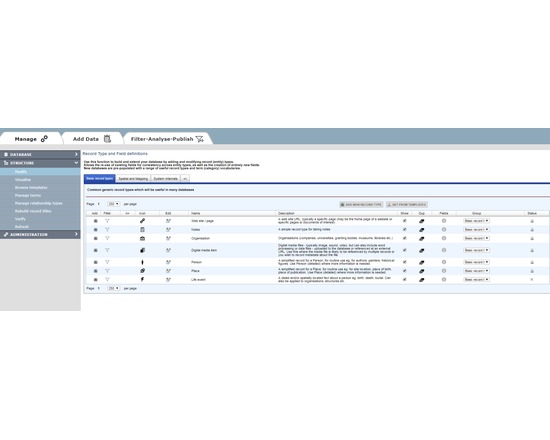
HEURIST (http://HeuristNetwork.org) is an extremely flexible, end-user oriented, web-based data management system designed specifically for Humanities data. Developed since 2005, it has been in active use across many projects since 2009. It is available both as a free web service for researchers (hosted at the University of Sydney Data Centre) or for installation on a physical or virtual server (Open Source on gitHub).
Researchers can design, create, manage, analyse, visualise and publish their own richly-structured database(s) through a simple web interface, without the need for programmer(s). Quite complex databases can be built in a few hours by borrowing structures and vocabularies published by other users. Databases can be designed and built incrementally, as existing data are not affected by changes in structure. Databases created by Heurist are stored in MySQL with a repeatable structure facilitating sustainability and independent access by other software.
Advanced features include record linking, graph structure, drill-down facet searches, rule-based queries, custom reports, linked map-timelines, network visualisation, normalised spreadsheet import, crosstabulation, XML feeds, XSLT transforms. The team provides initial email and skype assistance for project setup at no cost, and special customisations at modest cost.
Heurist is applicable in many domains including History, Archaeology, Anthropology, Cultural Research, Linguistics, Media Studies etc. It handles everything from text, tags and categories, through networks of rich relationships and offset annotations, to images, video, spatial data and dating (including non-western systems and dating uncertainty).
Sophisticated searches (including faceted and rule-based) can be saved, organised and rendered as layered interactive maps, timelines, network visualisations, crosstabulations, lists, custom reports, XML and XSLT transforms, all of which can easily be printed or embedded (live) in a website - Heurist provides the html code required to embed results in a web page or CMS.
Databases can easily be migrated later to a personal or institutional server. Since the data are stored in a standard MySQL database with a fixed and well-documented structure, the data can be accessed directly via SQL from most programming languages independently of Heurist.
Version 4.2 (Jan 2016 onwards) is available as a service via the Heurist website. Version 4 delivers a user-customisable interface of widgets, along with better mapping and visualisation. Existing version 3 databases are bidirectionally compatible with version 4.

Inkscape is an open-source vector based imaging programme similar to Adobe Illustrator, Corel Draw, Freehand, or Xara X.
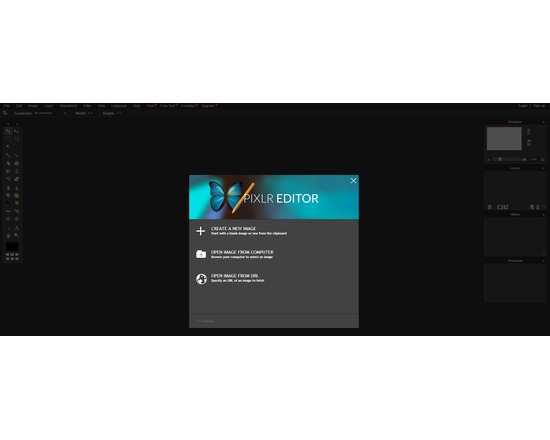
This is a free to use online image editor with a fair amount of features. I use this primarily for quick editing jobs such as resizing and cropping small images. The online editor will load images from your computer or via url which is incredibly handy. There is a firefox plug-in available too which makes the time it takes to view an image, edit, and save it, a fast process. The source code for the application is closed, but the dev team does offer a free API. Pixlr also has tools for mobile devices, one of which is paid app for $1.
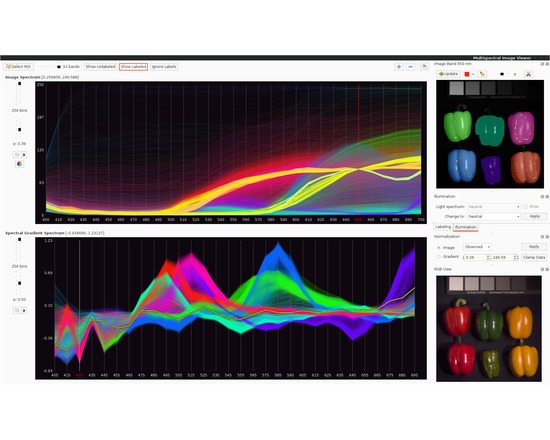
Gerbil is a generic framework for visualization and analysis of multispectral and hyperspectral data that strives to both bring new innovations in analysis capabilities and be of use in a wide range of hyperspectral data applications. In a nutshell, Gerbil lets you…
explore a multispectral or hyperspectral image before processing it,
apply common computer vision algorithms adapted to hyperspectral data,
cluster and label image pixels for your application scenario,
assess your own algorithms via high-dimensional data visualization,
use an intuitive interface for teaching multispectral imaging and reflectance analysis.
One example application for Gerbil is finding hidden information in multispectral scans of old manuscripts or art pieces.
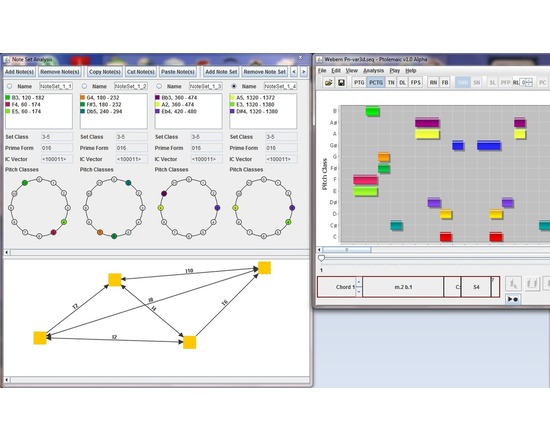
Ptolemaic is a computer application for music visualization and analysis written in the Java programming language. The software is designed to aid in the analysis of all types of Western music using established analytical techniques, including tonal functional analysis (Harrison 1994), pitch-class set analysis (Forte 1973), hierarchical linear analysis (Schenker 1935, Jones 2002), tonal pitch-space analysis on the Tonnetz (Riemann 1915), pitch-class set analysis (Forte 1973), and transformation analysis (Lewin 1987). Musical works and excerpts may be opened and saved using the de-facto standard music notation interchange format, MusicXML. To assist in analysis, Ptolemaic can display the music on a pitch/time graph, on a pitch-class/time graph, on a step-class/time graph (also called a diatonic lattice) (Jones 2002), on the Tonnetz, or using filtered point-symmetry (Douthett 2008). Pitch classes and chords are color coded so that the user can easily correlate them across each graph. The benefit of having a software tool to visualize and perform certain analysis tasks is in automating processes that are normally time-consuming for the musician, thus allowing the music scholar to focus on the musical issues, rather than the technical issues of graphing, and calculating chord classes. Ptolemaic provides useful ways of visualizing a piece of music and tools for gaining more information about that music, so that the user can efficiently make informed musical decisions about the music and preserve that analysis for future study.
TouchGraph is a Java application that creates network graphs of websites returned in Google searches.
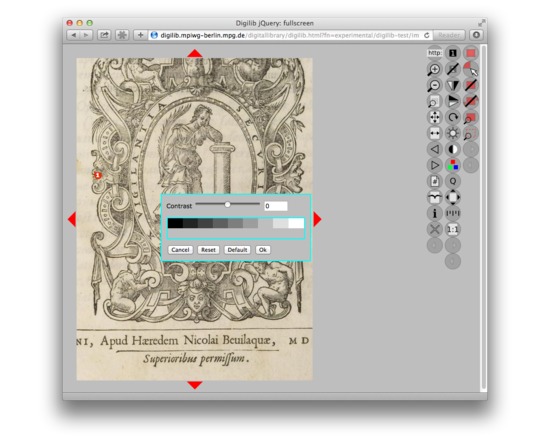
Digilib is a web based client/server technology for images. The image content is processed on-the-fly by a Java Servlet on the server side so that only the visible portion of the image is sent to the web browser on the client side. It supports a wide range of image formats and viewing options on the server side while only requiring an internet browser with javascript and a low bandwidth internet connection on the client side. digilib enables very detailed work on an image as required by scientists with elaborate zoom features like an option to show images on the screen in their original size. digilib facilitates cooperation of scientists over the internet and novel uses of source material by image annotations and stable references that can be embedded in URLs. digilib is used in the ALCATRAZ framework of image, text and annotation tools and many other projects.
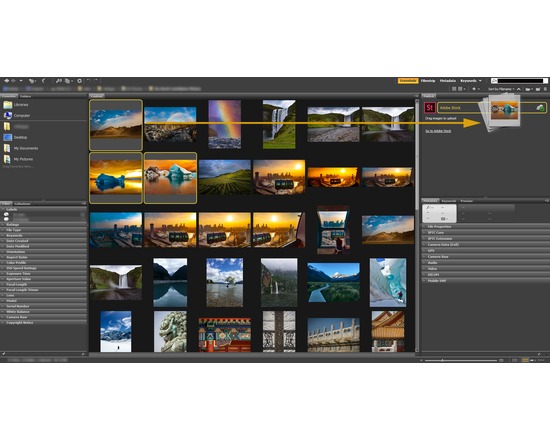
Adobe Bridge is a media management application used for organizing, browsing, locating, and viewing creative assets. It was provided as a part of the Adobe Creative Suite, beginning with CS2, and is now in version CS5
Features:
Tightly integrated with other Adobe suite software (except for the standalone version of Adobe Acrobat 8)
Extensible through use of Javascript