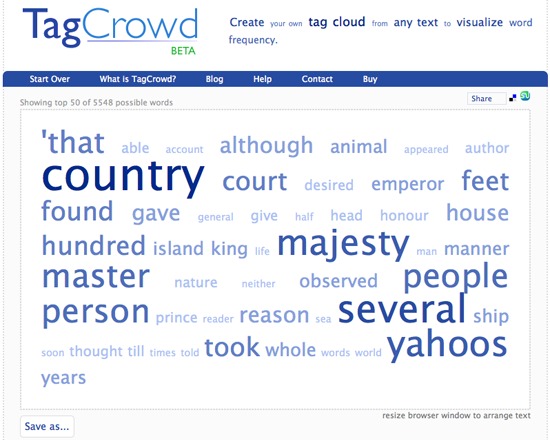
TagCrowd is a tool for generating a frequency-based word cloud from a source text, with a free browser version available through the TagCrowd website. A commercial version may also be purchased, subject to a creative commons license.
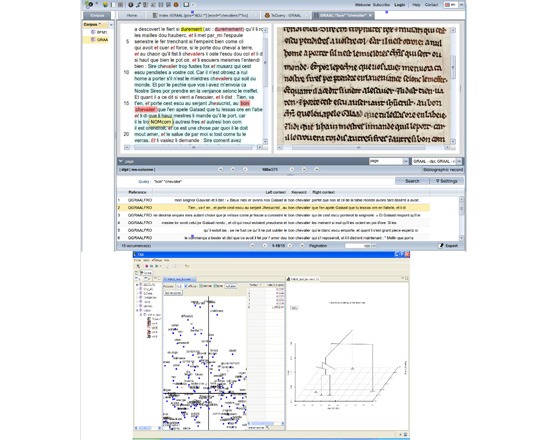
TXM is a free, open source text corpus analysis environment. Its features include concordance, collocate search, frequencies based on the CQP full text search engine and statistical functions based on R packages. It can export results in CSV, XML or SVG format, and runs as a standalone desktop application in Windows, OS X and Linux environments, or as a web portal (download the leaflet for more).
nodegoat creates visualizations and provides a graphical user interface for the maintenance of data. It combines a variety of data management functions into one program.
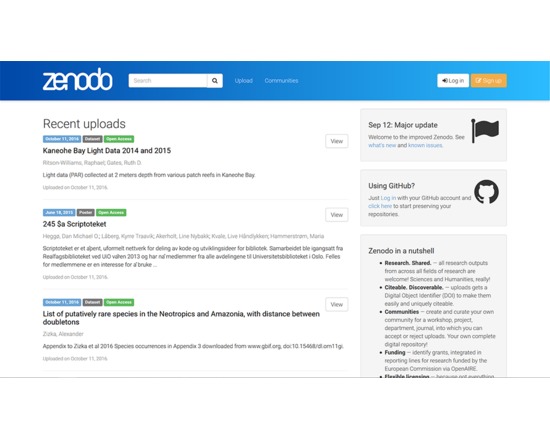
Zenodo is a catch-all repository for research data. It accepts all research data, with no requirements on format, size, access restrictions, or license. It is intended to support storage, curation, and publication of big research data. It was developed by the OpenAIRE partner CERN, responding to a request by the European Commission to create an open catch-all repository for all EC funded research.
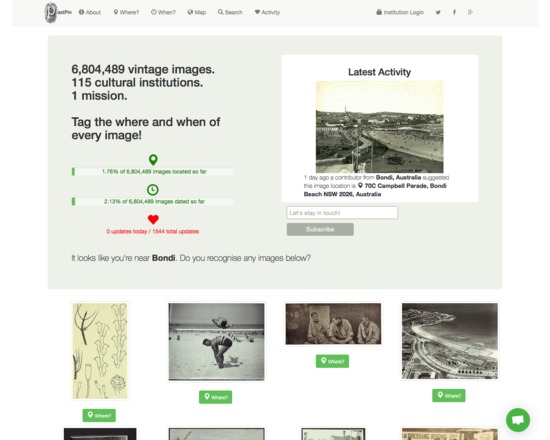
Pastpin is a cultural search engine that aims to showcase the 7M historical images available from Flickr Commons.
Users are prompted to add new metadata (geocodes, temporal data) to existing images that they may recognise based on their current location. The goal of the project is to crowdsource spatial and temporal metadata for these objects.
Visitors to the site can search or browse by using free text, or by going directly to the map and clicking on a thumbnail to view images directly.
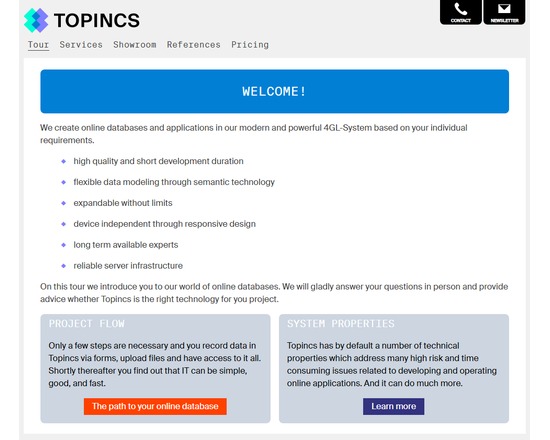
Topincs is a online database software. Given a data model, it allows data to be recorded and files to be uploaded and annotated through forms, data and files to be displayed and navigated through interconnected data sheets, and all that searched in the index. It overcomes the rigidity of relational databases by using semantic technology. In the simplest use case, a group of users can collaboratively edit information and upload files from any device with a web browser and an internet connection. Development time ranges between 1 and 8 hours.
By designing and implementing services, the data can be manipulated, transformed and aggregated through an virtual object oriented programming interface driven by the data model. This allows sophisticated use cases where different user groups with different rights are presented a completely different application working on the same database. In these cases development time ranges between 2 and 20 days.
A Topincs online database can be rented for a monthly fee. Topincs provide all services related to an online database: data modeling, programming, and support. They have special rates for educational institutions. Topincs can also be used as a Platform as a Service where the dark art of Topincs modeling and development must be studied online. The underlying semantic technology, Topic Maps, is taught there through hands on examples and will change your view on information technology.
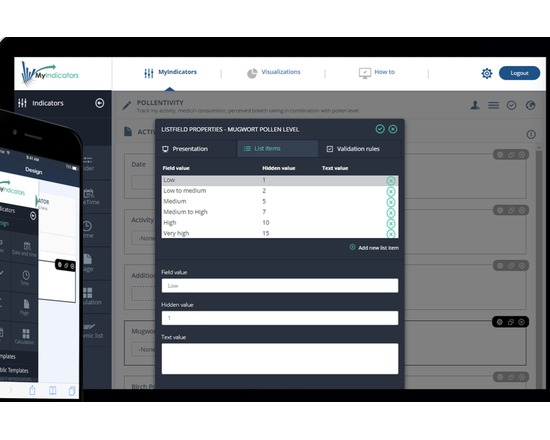
MyIndicators (http://myindicators.net/) is a digital, easy-to-use tool allows researchers, educators, students or anyone, to build their own tailored indicators (e.g. goals, strategies, parameters, survey, questions, calories intakes, alcohol consumptions or quantified self in terms of training, mood tracking or sleeping quality etc.)
The tool can be used for data collection, data storage, data analysis, data visualisation and export data (excel spreadsheet format). Easier to detect the trend and keep track based on the visualisation and using real time data.
There are free useful ready-made templates available for personal use. Besides research, education and quality industries, MyIndicators can be used by anyone who wishes to improve performance, achieve personal goals, promote healthy habits or gain personal insights. Educational and students discounts are available.
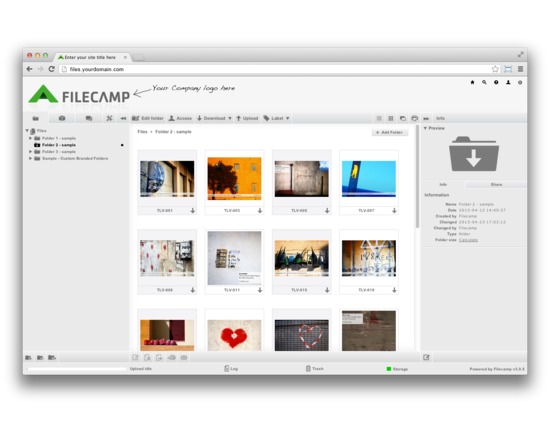
Online Digital Asset Management (DAM) and collaboration platform for business use. Offers user management, custom branding and password-protected folders.
Digital Asset Management, Secure File Sharing, Media Library, Online Proofing and so much more …
Upload, manage and share your files from one good looking, easy-to-use spot in the cloud.
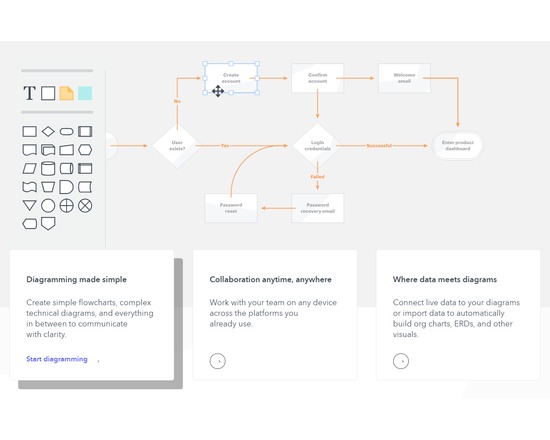
Lucidchart is an online diagram tool that enables users to easily visualize complex information through flow charts, mind maps and other diagram types. Multiple users can work together simultaneously to edit a document. Lucidchart integrates with many platforms including Google Apps/Drive, Confluence, JIRA, Slack, ec. Free accounts are provided for educational use.
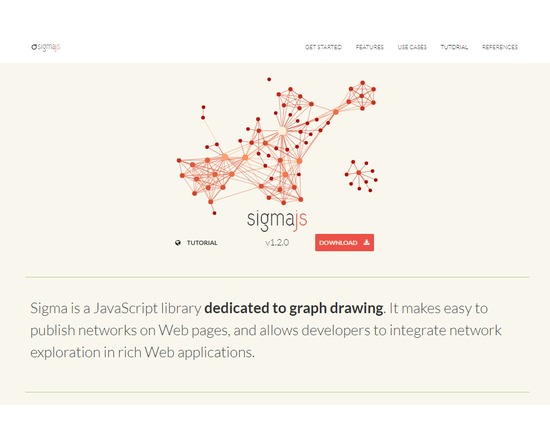
Sigma is a JavaScript library dedicated to graph drawing. It makes it easy to publish networks on Web pages, and allows developers to integrate network exploration in rich Web applications.
It is highly interactive and allows a researcher to extend their work from a dedicated graph analysis package such as Gephi and share it via the web to allow for communication of research outputs, while permitting viewers to explore and discover their own findings from the raw graph network.