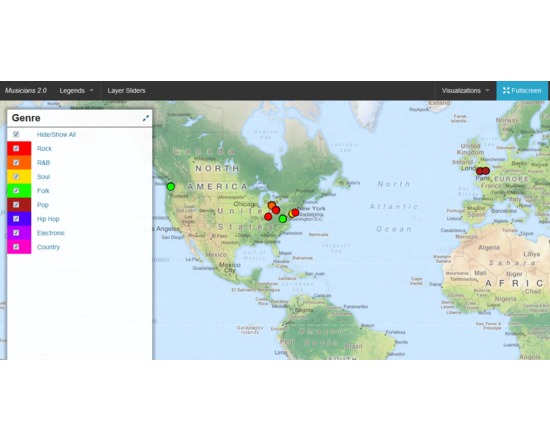
DH Press (originally called diPH) is a toolkit conceived as an easy-to-use WordPress plugin which allows potentially every kind of user to visualise and mashup historic and geographic information, documents and various types of multimedia content to develop digital humanities project.
The user cannot start from the toolkit itself, as the first step to set up a project, when the toolkit is already installed, is a CSV import. This means that the raw information has to be processed first, through any software like Microsoft Excel or Google Spreadsheet, following some conventions dictated by the toolkit, and once completed must be exported in CSV format. The file can then be imported into DH Press.
At this point, the user finally has full control over the data. First, the toolkit needs to be informed of what kind of data is in each column, as it can handle various types, such as Short Text, Long Text, Lat/Lon, Date, and Link. The steepest learning curve resides here, in the data management part, as the database must be set up very carefully, and fixing any problem later is complex. This does not mean that new users cannot approach the tool, but some basic research on data management is required to make correct use of it.
After setting up all this fields, called “motes” in the toolkit, a legend can be assigned to each of them, for example a field called “city” might contain, through multiple entries, ten different cities, and to each of those will correspond the colour chosen by the user. It is also possible to assign icons or png images instead of colours.
A single control panel then allows the user to create, set up and manage multiple visualisations of different kind, and in each of them the user can choose which information to display and how. This part is the most useful and is really straightforward.
The last section of the control panel lets the user set up custom fields for data and run a test of the whole project, and outputs detailed error information.
Following the training page, http://dhpress.org/training/, it is possible to take advantage of a pre-existing database, which can be used to quickly set up a project, so that one can instantly work on the main control panel. There is a detailed google document that guides the user through the process step by step, and also offers an even more detailed annex. A couple of hours is enough to go through all of it and get the necessary information to use it correctly. Then, any view can be quickly set up and customised in any desired way.
Overall, this toolkit is quite stable, reliable, user-friendly after the first entry barrier and gives you a varied set of tools to visualise and display a large amount of data in a neat, organised manner.
For a more detailed and personal review, please read http://claudiasartori.com/2015/01/tool-review-dh-press/
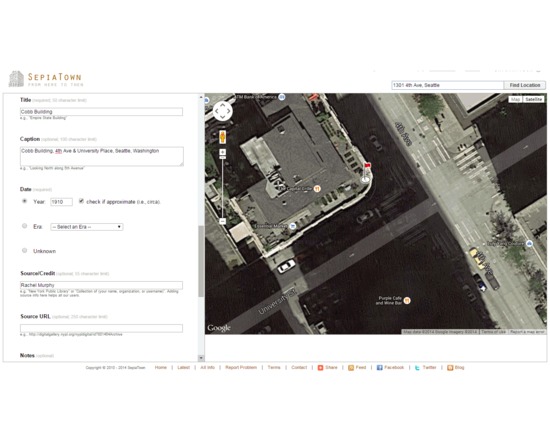
SepiaTown is a cultural history project that aims to provide a window to the past by merging photography, geography, and technology, by acting as a forum for institutions and individuals to share and map historical images.
Once they have signed up, users may upload historic images to the site individually or in batches. Each image is given a title, description and keywords, as well as a spatial location represented by a marker on a map.
Visitors to the site can search or browse by using keywords and place-names, or by going directly to the map and clicking on a thumbnail to view images directly.
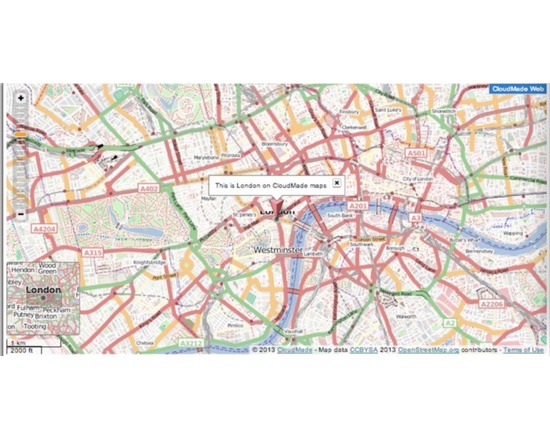
Mapstraction is a Javascript library. It provides developers with a single interface for a wide variety of Javascript map APIs including Leaflet, Google, Bing, OpenLayers and ESRI's ArcGIS.
A key benefit is that once a developer has loaded Mapstraction, s/he can to switch from one map API to another quickly and easily - often only needing to change a few lines of code.
Mapstraction displays points, lines, polygons and markers on the maps, and also allows developers to add base maps and overlays.