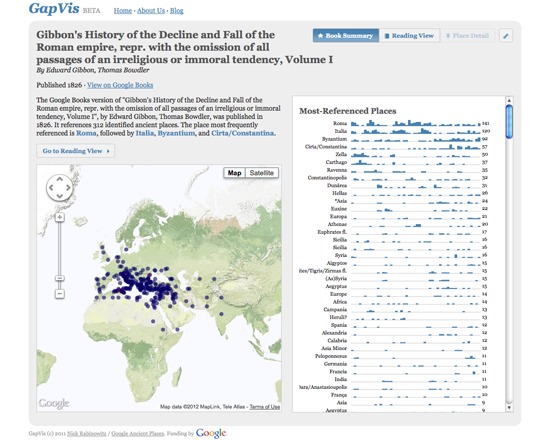
GapVis is a free tool developed in conjunction with Google Ancient Places to visualize the locations within and allow the exploration of books referencing ancient places within the Google Books collection. Users can view text summaries, use an enhanced reading interface and explore the location references through a place detail view. It is intended both to enable location-based text discovery, and to allow users to delve more deeply into a text based on the locations referenced within it. GapVis is currently in beta.
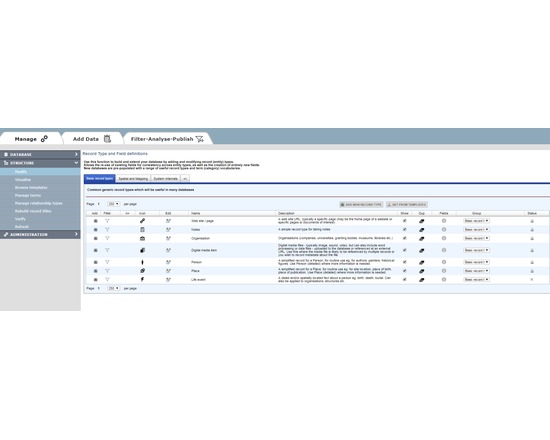
HEURIST (http://HeuristNetwork.org) is an extremely flexible, end-user oriented, web-based data management system designed specifically for Humanities data. Developed since 2005, it has been in active use across many projects since 2009. It is available both as a free web service for researchers (hosted at the University of Sydney Data Centre) or for installation on a physical or virtual server (Open Source on gitHub).
Researchers can design, create, manage, analyse, visualise and publish their own richly-structured database(s) through a simple web interface, without the need for programmer(s). Quite complex databases can be built in a few hours by borrowing structures and vocabularies published by other users. Databases can be designed and built incrementally, as existing data are not affected by changes in structure. Databases created by Heurist are stored in MySQL with a repeatable structure facilitating sustainability and independent access by other software.
Advanced features include record linking, graph structure, drill-down facet searches, rule-based queries, custom reports, linked map-timelines, network visualisation, normalised spreadsheet import, crosstabulation, XML feeds, XSLT transforms. The team provides initial email and skype assistance for project setup at no cost, and special customisations at modest cost.
Heurist is applicable in many domains including History, Archaeology, Anthropology, Cultural Research, Linguistics, Media Studies etc. It handles everything from text, tags and categories, through networks of rich relationships and offset annotations, to images, video, spatial data and dating (including non-western systems and dating uncertainty).
Sophisticated searches (including faceted and rule-based) can be saved, organised and rendered as layered interactive maps, timelines, network visualisations, crosstabulations, lists, custom reports, XML and XSLT transforms, all of which can easily be printed or embedded (live) in a website - Heurist provides the html code required to embed results in a web page or CMS.
Databases can easily be migrated later to a personal or institutional server. Since the data are stored in a standard MySQL database with a fixed and well-documented structure, the data can be accessed directly via SQL from most programming languages independently of Heurist.
Version 4.2 (Jan 2016 onwards) is available as a service via the Heurist website. Version 4 delivers a user-customisable interface of widgets, along with better mapping and visualisation. Existing version 3 databases are bidirectionally compatible with version 4.
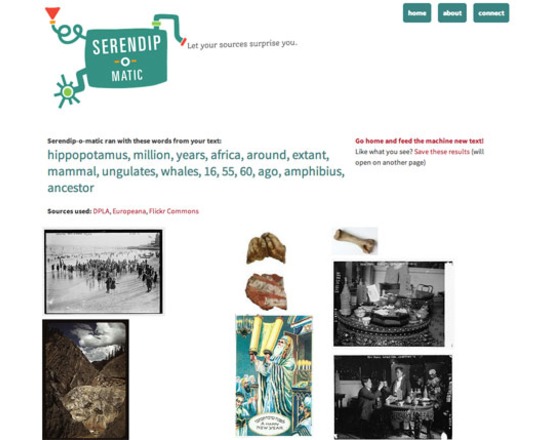
Serendip-o-matic extracts keywords from your Zotero library or from text that you've pasted into the web interface, and finds related content in locations such as the Digital Public Library of America (DPLA), Europeana, and Flickr Commons, including photographs, documents, maps and other primary sources.
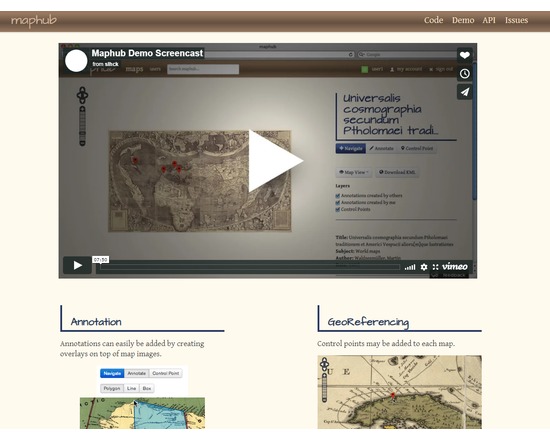
Maphub is a web portal for georeferencing and annotating digitized historic maps. Georeferencing transforms the map image to align with real world geographic coordinates, while the annotations are overlaps plus notes. Maphub suggests possible tags for the annotation based on its text and location; tags link to related Wikipedia articles. Once created, user-contributed annotations are shared via the Maphub Open Annotation API.
A first prototype of Maphub, using digitized maps from the Library of Congress’ Map Division, can be found at http://maphub.herokuapp.com/.
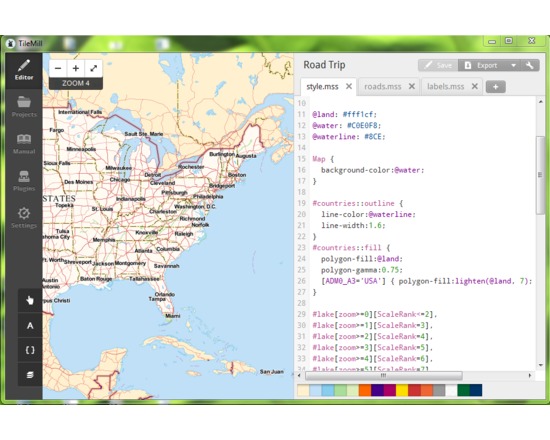
Open source map design studio for creating and styling web tile maps, based on either provided free MapBox Geodata, or data imported as a variety of file formats. It uses the CartoCSS styling language to customize interactive visualizations, with powerful control of symbols, zoom levels, labels, and other cartographic details. The finished maps can be exported either as images or tiled web maps. Though the TileMill software is free, there may be a fee to host the created tiles on MapBox or elsewhere.
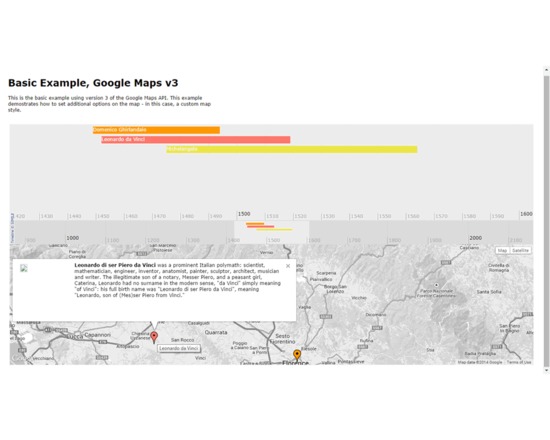
Timemap.js is a Javascript library that helps you to produce online maps (such as Google, OpenLayers, and Bing) along with a SIMILE timeline. You can load one or more datasets (in JSON, KML, or GeoRSS) onto both a map and a timeline simultaneously. By default, only items in the visible range of the timeline are displayed on the map.
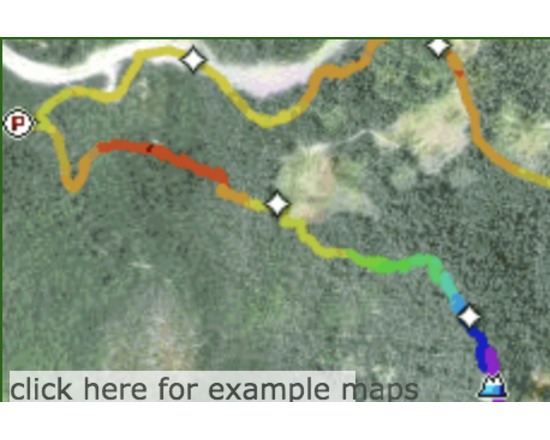
GPS Visualizer is a free, easy-to-use online utility that creates maps and profiles from GPS data.
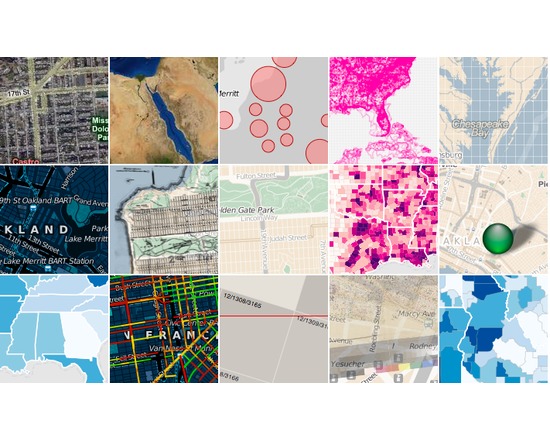
Polymaps is a free JavaScript library for making dynamic, interactive maps in modern web browsers. Polymaps provides speedy display of multi-zoom datasets over maps, and supports a variety of visual presentations for tiled vector data, in addition to the usual cartography from OpenStreetMap, CloudMade, Bing, and other providers of image-based web maps. Birmingham Airport Parking Manchester Meet and Greet
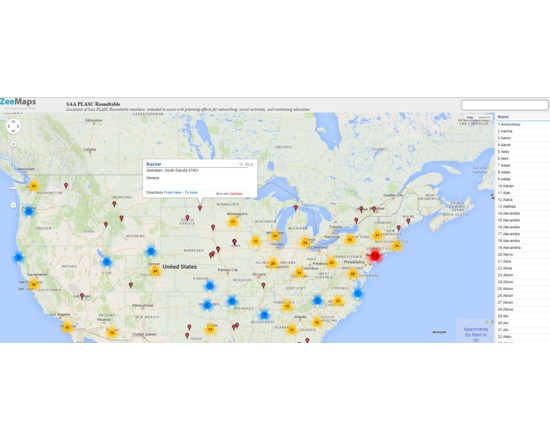
1) The user uploads a .csv file of data points and their locations.
2) A group of users all add their own data location points to the map, on their own time from their own devices.
Each point can include text, video, image, or audio annotations.
Basic functionality is free; larger uploads and large numbers of maps require a paid subscription.
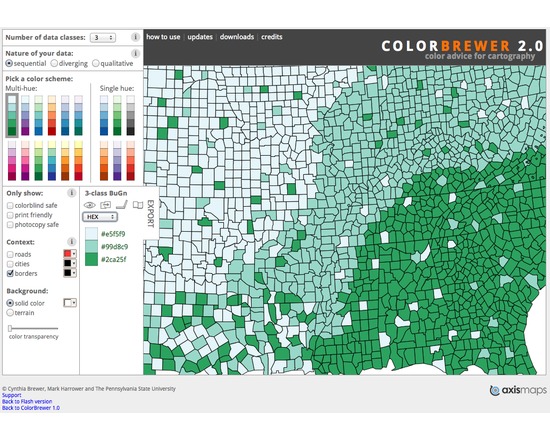
ColorBrewer is a web tool for selecting color schemes for thematic maps, most usually for choropleth maps. It includes 35 basic schemes with different numbers of classes for over 250 possible versions. Each scheme has CMYK, RGB, Hex, Lab, and AV3 (HSV) specs for the colors. The software is designed simply to list color specs for a scheme you find useful so you are able to create these colors in the mapping software you are using.
It should be noted that ColorBrewer is not mapping software. It is designed specifically for users to look up color sets to use in mapping environments. It does not allow you to read in your own data and it will not open any other geography files.