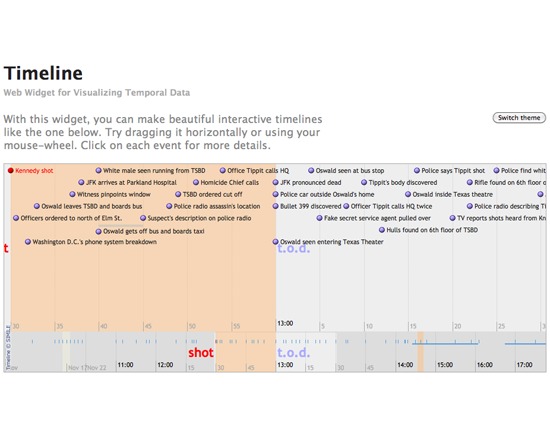
Timeline, a part of the SIMILE Widgets family of tools, is a free, open source tool for creating interactive timelines from temporal data utilizing JavaScript and web markup in HTML and XML.
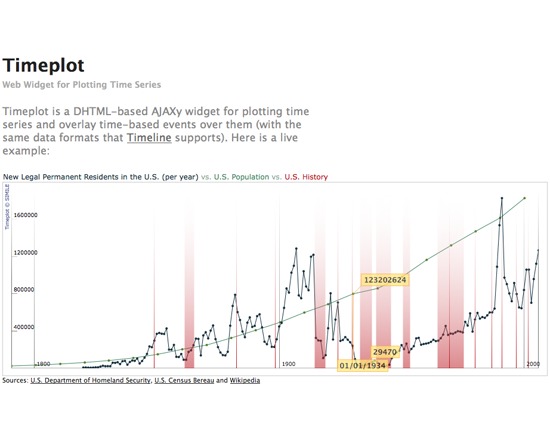
TimePlot, a part of the SIMILE Widgets family of tools, is a free, open source DHTML-based AJAXy widget for plotting time series and overlaying time-based events over them. The overlays use the same data formats supported by the related SIMILE Widgets Timeline tool. Timeplots are generated with a combination of JavaScript and HTML.
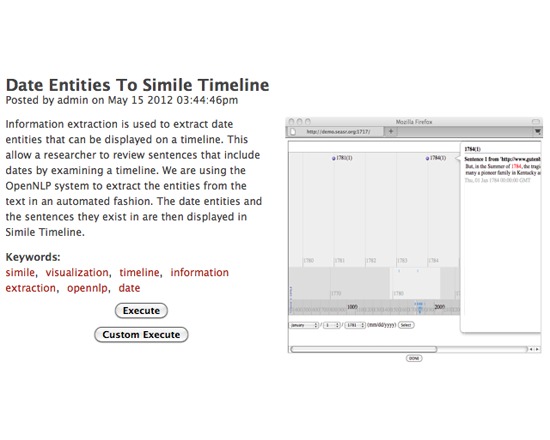
SEASR's Date Entities to Similie Timeline is a free tool for extracting data entities that may be displayed on a timeline. It uses OpenNLP to extract sentences containing dates, and SIMILE Timeline to display them.
Timeline Builder is a free tool for creating and maintaining interactive, Flash-based timelines for viewing on the web. Basic text formatting and links to other resources can be added through basic HTML. This tool requires registration through the web page.
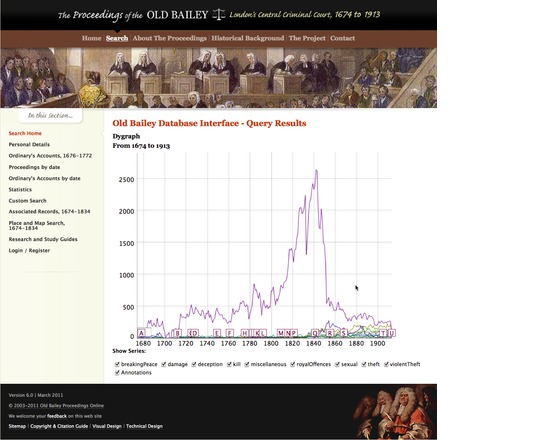
This prototype was produced as a proof-of-concept for the Criminal Intent project. It allows the records of the Old Bailey Online project to be searched such that the returned results can be viewed as either a timeline or a concordance of terms. The tool allows for reasonably complex queries to be placed and a range of different formats for the returned charts to be selected. The tool is primarily built with Python and SQLite and makes use of the Google Chart API for some output options.
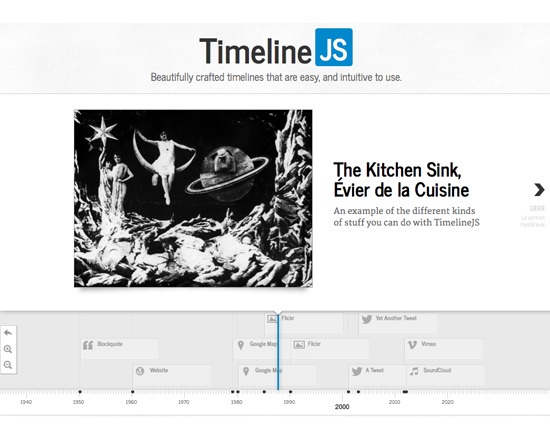
Timeline JS is a free timeline tool that can be poplulated from either a Google spreadsheet or a JSON file, and can draw media material from a variety of sources, such as Twitter, Flickr, Wikipedia, YouTube and more. It has been designed to be both easy to use and easy to embed the results in another web page.
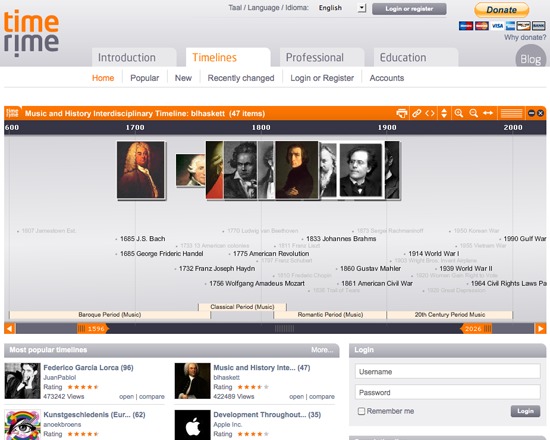
TimeRime is a free, web-based timeline application for creating, viewing and comparing interactive timelines. This application requires registration, and timelines created within the application are public.
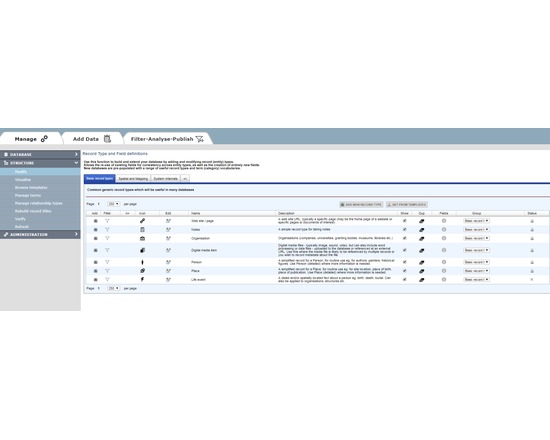
HEURIST (http://HeuristNetwork.org) is an extremely flexible, end-user oriented, web-based data management system designed specifically for Humanities data. Developed since 2005, it has been in active use across many projects since 2009. It is available both as a free web service for researchers (hosted at the University of Sydney Data Centre) or for installation on a physical or virtual server (Open Source on gitHub).
Researchers can design, create, manage, analyse, visualise and publish their own richly-structured database(s) through a simple web interface, without the need for programmer(s). Quite complex databases can be built in a few hours by borrowing structures and vocabularies published by other users. Databases can be designed and built incrementally, as existing data are not affected by changes in structure. Databases created by Heurist are stored in MySQL with a repeatable structure facilitating sustainability and independent access by other software.
Advanced features include record linking, graph structure, drill-down facet searches, rule-based queries, custom reports, linked map-timelines, network visualisation, normalised spreadsheet import, crosstabulation, XML feeds, XSLT transforms. The team provides initial email and skype assistance for project setup at no cost, and special customisations at modest cost.
Heurist is applicable in many domains including History, Archaeology, Anthropology, Cultural Research, Linguistics, Media Studies etc. It handles everything from text, tags and categories, through networks of rich relationships and offset annotations, to images, video, spatial data and dating (including non-western systems and dating uncertainty).
Sophisticated searches (including faceted and rule-based) can be saved, organised and rendered as layered interactive maps, timelines, network visualisations, crosstabulations, lists, custom reports, XML and XSLT transforms, all of which can easily be printed or embedded (live) in a website - Heurist provides the html code required to embed results in a web page or CMS.
Databases can easily be migrated later to a personal or institutional server. Since the data are stored in a standard MySQL database with a fixed and well-documented structure, the data can be accessed directly via SQL from most programming languages independently of Heurist.
Version 4.2 (Jan 2016 onwards) is available as a service via the Heurist website. Version 4 delivers a user-customisable interface of widgets, along with better mapping and visualisation. Existing version 3 databases are bidirectionally compatible with version 4.
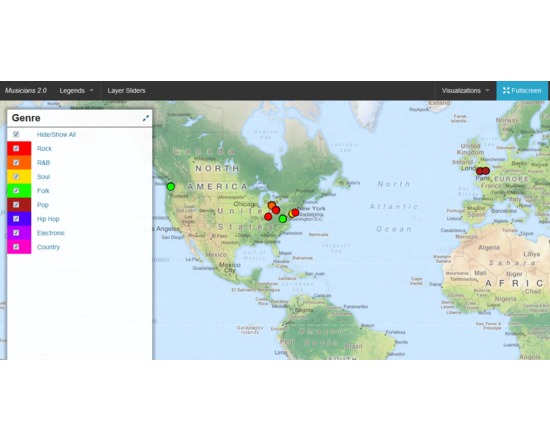
DH Press (originally called diPH) is a toolkit conceived as an easy-to-use WordPress plugin which allows potentially every kind of user to visualise and mashup historic and geographic information, documents and various types of multimedia content to develop digital humanities project.
The user cannot start from the toolkit itself, as the first step to set up a project, when the toolkit is already installed, is a CSV import. This means that the raw information has to be processed first, through any software like Microsoft Excel or Google Spreadsheet, following some conventions dictated by the toolkit, and once completed must be exported in CSV format. The file can then be imported into DH Press.
At this point, the user finally has full control over the data. First, the toolkit needs to be informed of what kind of data is in each column, as it can handle various types, such as Short Text, Long Text, Lat/Lon, Date, and Link. The steepest learning curve resides here, in the data management part, as the database must be set up very carefully, and fixing any problem later is complex. This does not mean that new users cannot approach the tool, but some basic research on data management is required to make correct use of it.
After setting up all this fields, called “motes” in the toolkit, a legend can be assigned to each of them, for example a field called “city” might contain, through multiple entries, ten different cities, and to each of those will correspond the colour chosen by the user. It is also possible to assign icons or png images instead of colours.
A single control panel then allows the user to create, set up and manage multiple visualisations of different kind, and in each of them the user can choose which information to display and how. This part is the most useful and is really straightforward.
The last section of the control panel lets the user set up custom fields for data and run a test of the whole project, and outputs detailed error information.
Following the training page, http://dhpress.org/training/, it is possible to take advantage of a pre-existing database, which can be used to quickly set up a project, so that one can instantly work on the main control panel. There is a detailed google document that guides the user through the process step by step, and also offers an even more detailed annex. A couple of hours is enough to go through all of it and get the necessary information to use it correctly. Then, any view can be quickly set up and customised in any desired way.
Overall, this toolkit is quite stable, reliable, user-friendly after the first entry barrier and gives you a varied set of tools to visualise and display a large amount of data in a neat, organised manner.
For a more detailed and personal review, please read http://claudiasartori.com/2015/01/tool-review-dh-press/