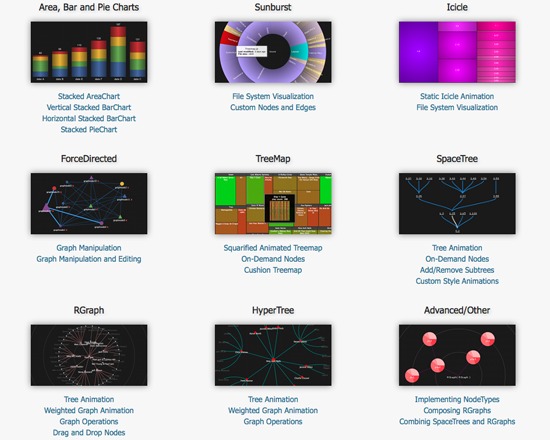
The JavaScript InfoVis Toolkit is a free set of tools for creating interactive data visualizations compatible with web standards. Visualization options include bar graphs, radial graphs, tree graphs and more, many integrating animations.
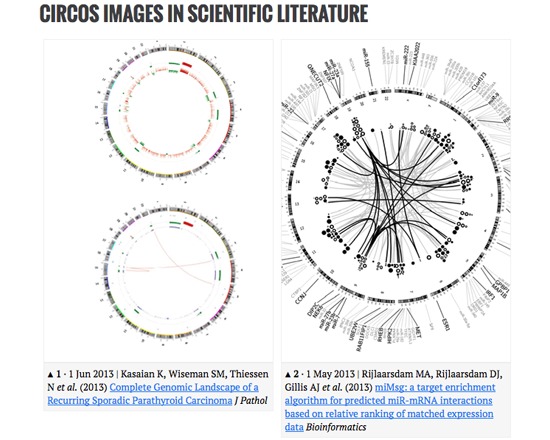
Circos is a free visualization tool for creating publication-quality infographics and illustrations. Its visualizations are arranged in a circle to facilitate exploring relationships between objects and positions, which also has the benefit of offering a high data-to-ink ratio. Though promoted for the sciences, it is highly flexible and can visualize datasets from a wide variety of fields.
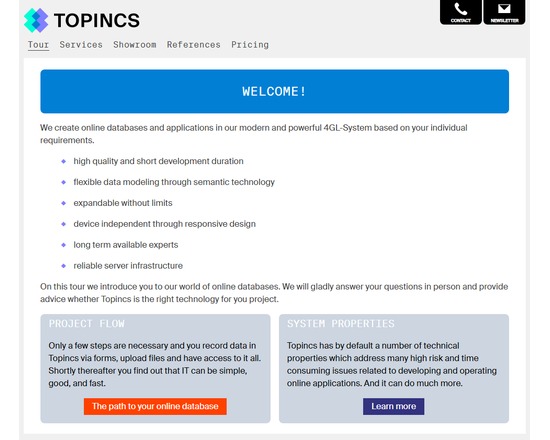
By designing and implementing services, the data can be manipulated, transformed and aggregated through an virtual object oriented programming interface driven by the data model. This allows sophisticated use cases where different user groups with different rights are presented a completely different application working on the same database. In these cases development time ranges between 2 and 20 days.
A Topincs online database can be rented for a monthly fee. Topincs provide all services related to an online database: data modeling, programming, and support. They have special rates for educational institutions. Topincs can also be used as a Platform as a Service where the dark art of Topincs modeling and development must be studied online. The underlying semantic technology, Topic Maps, is taught there through hands on examples and will change your view on information technology.
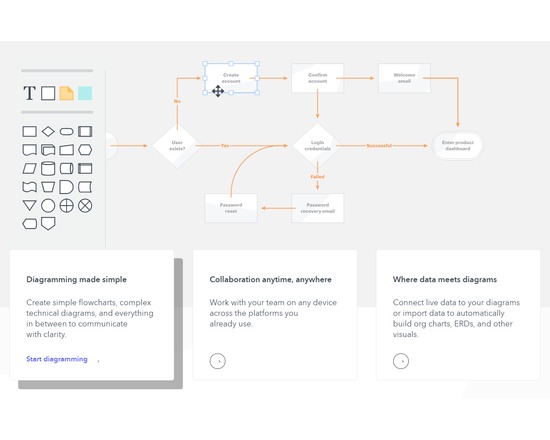
Lucidchart is an online diagram tool that enables users to easily visualize complex information through flow charts, mind maps and other diagram types. Multiple users can work together simultaneously to edit a document. Lucidchart integrates with many platforms including Google Apps/Drive, Confluence, JIRA, Slack, ec. Free accounts are provided for educational use.

Lucidpress is a free online editor for making pamphlets, brochures, flyers, magazines, and more. Features include real-time collaboration, digital publishing, and easy sharing, all of which come in an intuitive, drag-and-drop interface. Upgrade to a professional account for increased storage space and access to additional templates.
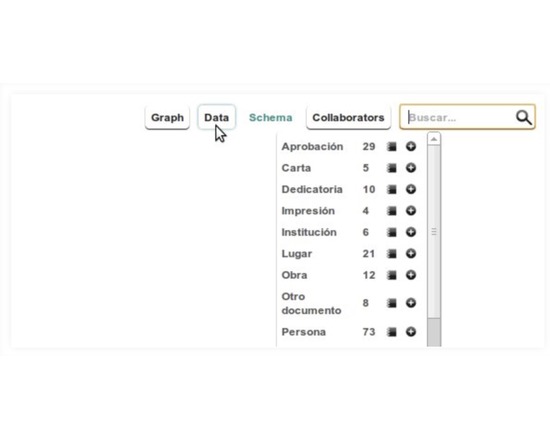
SylvaDB is a graph database management system. It allows users with no knowledge in graph theory to model, collect, query, and analyze data in a network structure. SylvaDB provides tools for easy creation of schemas and modelling, automatic forms creation to input the data, collaborative features, a visual query editor, global and local search, reports charts generation, networks metrics, and visualizations tools.
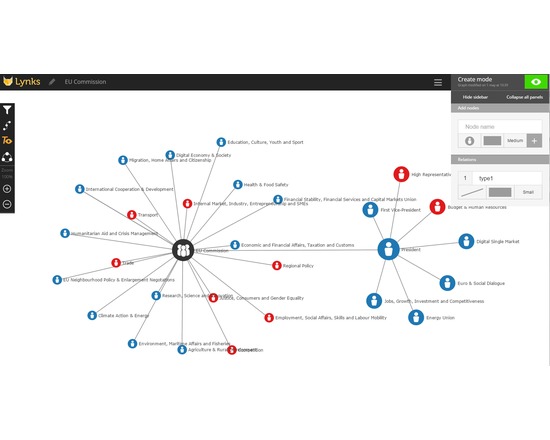
Lynks provides an easy to use, in-browser tool that helps you to create your own networks. Lynks is an initiative by Centre for Innovation, part of Leiden University (Campus The Hague). The software has been developed in 2014 in co-creation, with expertise from Dr. Eelke Heemskerk from University of Amsterdam. The software development has been supported by the financial contributions from the European Union Fund for Regional Development (EFRO) and the Municipality of The Hague.
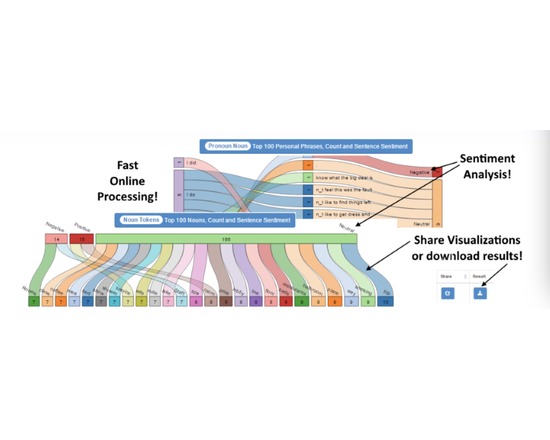
SentimentBuilder is an online tool that performs text analytics on emails, reviews, feedback, chat data or any unstructured texts via Natural Language Processing. It's the only tool where you can upload a file for processing and then visually view the results in a Sankey Flow Report to quickly identify trends, issues and strengths and then customize each view, save and share! Export any result for your own offline analysis! Try the Always Free version today and upload your own data or try one of our sample files.
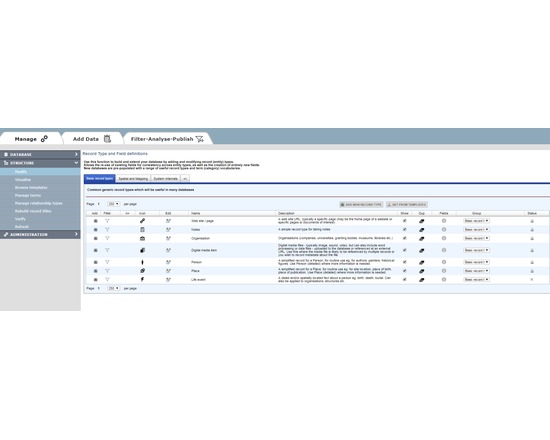
HEURIST (http://HeuristNetwork.org) is an extremely flexible, end-user oriented, web-based data management system designed specifically for Humanities data. Developed since 2005, it has been in active use across many projects since 2009. It is available both as a free web service for researchers (hosted at the University of Sydney Data Centre) or for installation on a physical or virtual server (Open Source on gitHub).
Researchers can design, create, manage, analyse, visualise and publish their own richly-structured database(s) through a simple web interface, without the need for programmer(s). Quite complex databases can be built in a few hours by borrowing structures and vocabularies published by other users. Databases can be designed and built incrementally, as existing data are not affected by changes in structure. Databases created by Heurist are stored in MySQL with a repeatable structure facilitating sustainability and independent access by other software.
Advanced features include record linking, graph structure, drill-down facet searches, rule-based queries, custom reports, linked map-timelines, network visualisation, normalised spreadsheet import, crosstabulation, XML feeds, XSLT transforms. The team provides initial email and skype assistance for project setup at no cost, and special customisations at modest cost.
Heurist is applicable in many domains including History, Archaeology, Anthropology, Cultural Research, Linguistics, Media Studies etc. It handles everything from text, tags and categories, through networks of rich relationships and offset annotations, to images, video, spatial data and dating (including non-western systems and dating uncertainty).
Sophisticated searches (including faceted and rule-based) can be saved, organised and rendered as layered interactive maps, timelines, network visualisations, crosstabulations, lists, custom reports, XML and XSLT transforms, all of which can easily be printed or embedded (live) in a website - Heurist provides the html code required to embed results in a web page or CMS.
Databases can easily be migrated later to a personal or institutional server. Since the data are stored in a standard MySQL database with a fixed and well-documented structure, the data can be accessed directly via SQL from most programming languages independently of Heurist.
Version 4.2 (Jan 2016 onwards) is available as a service via the Heurist website. Version 4 delivers a user-customisable interface of widgets, along with better mapping and visualisation. Existing version 3 databases are bidirectionally compatible with version 4.