CartoDB
- Last Updated: 10/5/2018 12:00:00 AM
- Site: https://carto.com/
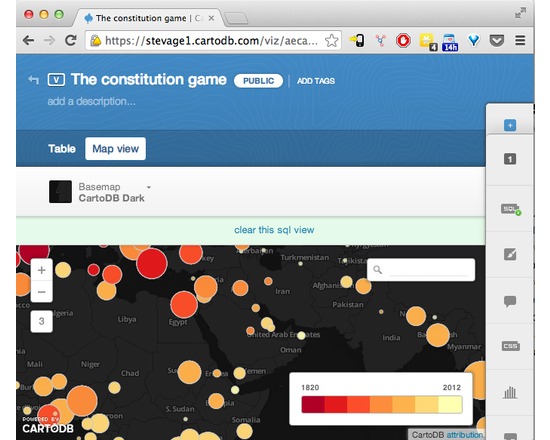
CartoDB makes data-driven map visualisation tool. It's very easy to upload a couple of spreadsheets of data, with latitudes and longitudes or addresses, and turn them into clickable markers on maps. There are several types of pre-canned visualisation, such as categories, choropleths or even animated "torque" maps. It's also a sophisticated platform allowing complex visualisations to be built up using Javascript and the CartoDB API.
Attributes
- Type of analysis: Visualization Publishing Analysis Dissemination
- Web Usable: Other
- Ease of Use: Easy
- TaDiRAH Goals: Analysis Dissemination
- TaDiRAH Methods: Publishing Spatial Analysis Visualization
List this tool appear on
Rating
Suggested Tools
Comments
CartoDB is mentioned int these research abstracts https://dh2018.adho.org/en/can-non-representational-space-be-mapped-the-case-of-black-geographies/, https://dh2018.adho.org/en/mapping-the-movida-re-imagining-counterculture-in-post-franco-spain-1975-1992/