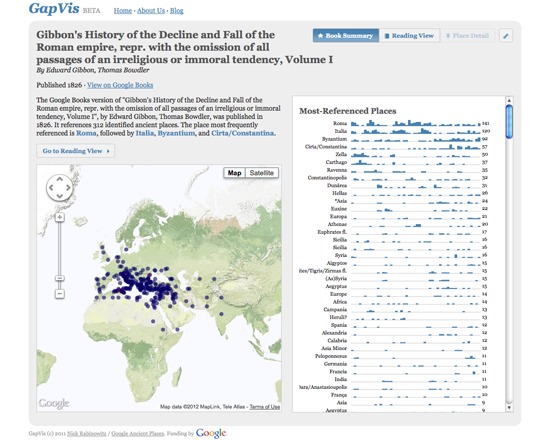
GapVis is a free tool developed in conjunction with Google Ancient Places to visualize the locations within and allow the exploration of books referencing ancient places within the Google Books collection. Users can view text summaries, use an enhanced reading interface and explore the location references through a place detail view. It is intended both to enable location-based text discovery, and to allow users to delve more deeply into a text based on the locations referenced within it. GapVis is currently in beta.
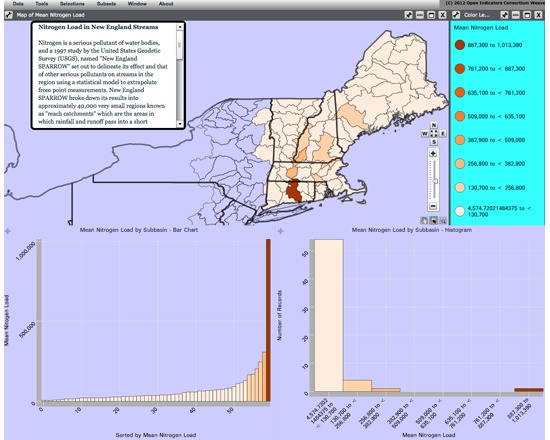
WEAVE (Web-based Analysis and Visualization Environment) is a web-based visualization platform offered by the Institute for Visualization and Perception Research at the University of Massachusetts Lowell. It is designed to visualize any data for any purpose, and to accommodate novice and advanced users alike. It includes the ability to integrate, disseminate and visualize data at nested levels of geography. WEAVE is currently in beta. Both a web-based demo and a download version are available.
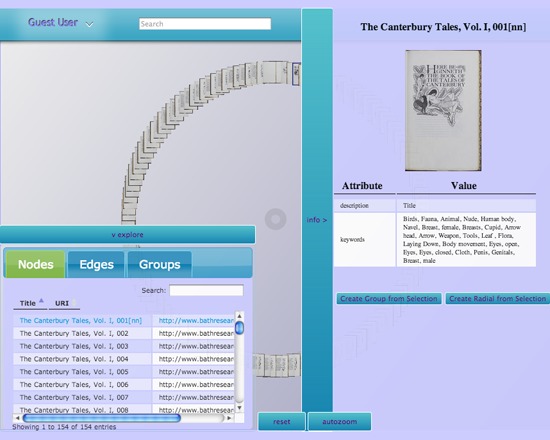
NewRadial is an interactive visualization environment from the INKE team. It is designed to permit search, sorting and manipulation of database objects, commentary on connections and associations between database objects, and offer a place for large edition projects to create curated environments, browse them and encourage secondary scholarship on them. A web version is available with a number of databases for exploration, including the Canturbury Tales, Shakespeare quartos and selected novels and poetry.
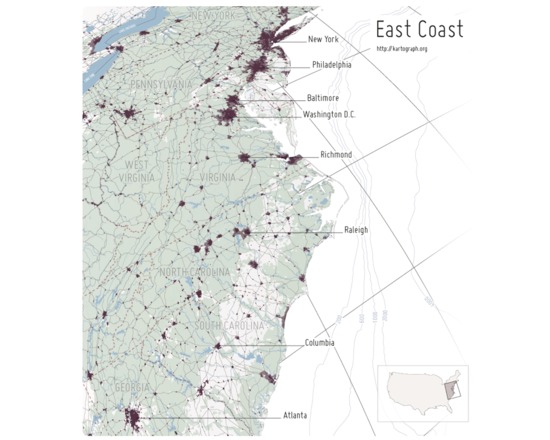
Kartograph is a pair of free and open source libraries for representing data with a spatial component on webpages or in print. The first library, Kartograph.py, is a Python library that builds lightweight vector graphic maps from either shapefiles or PostGIS tables. These graphics files can be styled either using a cascading style sheet during creation or later on the second library, Kartograph.js. The vector files can also be edited and enhanced in a vector graphics program like Adobe Illustrator.
Kartograph.js allows the user to create interactive maps for web pages and web applications, using vector graphics files and data files to both draw the basemap and the features of interest. Unlike many web-based mapping libraries, Kartograph.js requires no server or even internet connection. All of the pertinent information is in the vector and data files. The results are highly customizable and can absolutely arresting, visually.
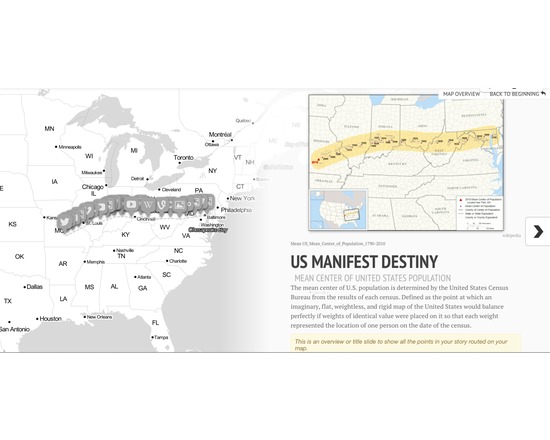
StoryMapJS is a project by KnightLab which aims to help journalists and historians tell stories by using maps using a straight-forward and simple authoring tool. It is constructed around a framework of highlighting the locations of a series of events. As an editing tool, it is relatively intuitive and easy to use.
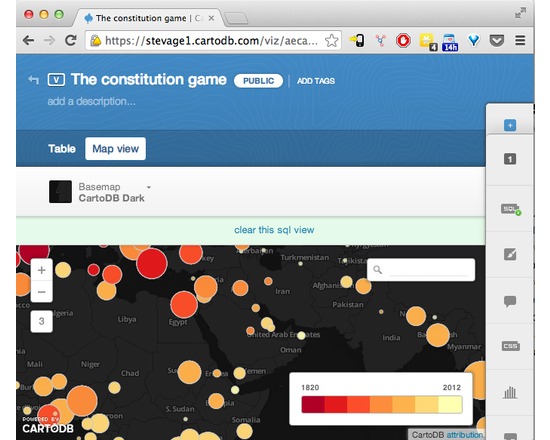
CartoDB makes data-driven map visualisation tool. It's very easy to upload a couple of spreadsheets of data, with latitudes and longitudes or addresses, and turn them into clickable markers on maps. There are several types of pre-canned visualisation, such as categories, choropleths or even animated "torque" maps. It's also a sophisticated platform allowing complex visualisations to be built up using Javascript and the CartoDB API.
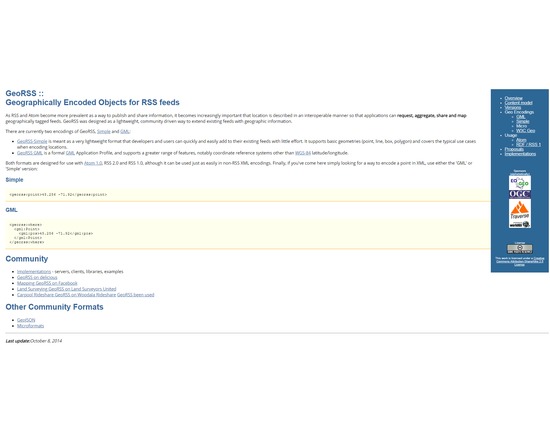
Geographically Encoded Objects for RSS feeds. GeoRSS was designed as a lightweight, community driven way to extend existing feeds with geographic information.
As RSS and Atom become more prevalent as a way to publish and share information, it becomes increasingly important that location is described in an interoperable manner so that applications can request, aggregate, share and map geographically tagged feeds.RSS Map of Digital Humanities centers
Two primary GeoRSS encoding exist, including GeoRSS Geography Markup Language (GML) and GeoRSS Simple. GeoRSS-Simple is a lightweight format that supports basic geometries of point, line, box, polygon. GeoRSS GML is a Open Geospatial Consortium (OGC) GML Application Profile, and supports a greater range of features than GeoRSS Simple.
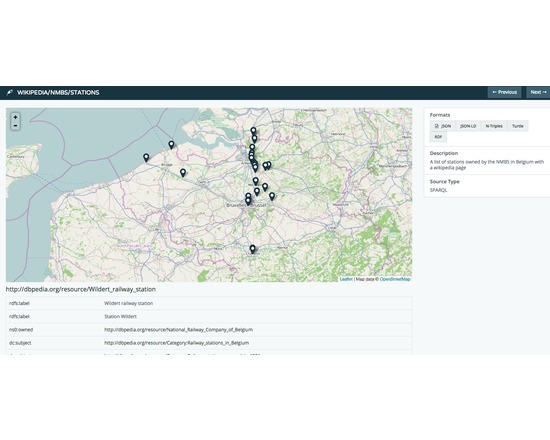
The DataTank is an open source tool that publishes data, stored in text-based files (e.g., CSV, XML, JSON) or in binary structures (e.g., SHP files, relational databases). The DataTank reads data from these structures and publishes them to the web using a URI as an identifier, providing these data in any format a user wants regardless of the original data structure. The DataTank requires a server with Apache2 or Nginx, mod rewrite enabled, PHP 5.4 or higher, Git, any database supported by Laravel 4.
Features
Turn any dataset into a RESTful HTTP API
Allows published data to be requested in any web-readable format or visualization
Improves the ease, openness, and transparency of data consumption
Enables data consumers to immediately begin working, without needing to download raw data files
Provides visualizations for immediate data interpretation and information gathering by civilians
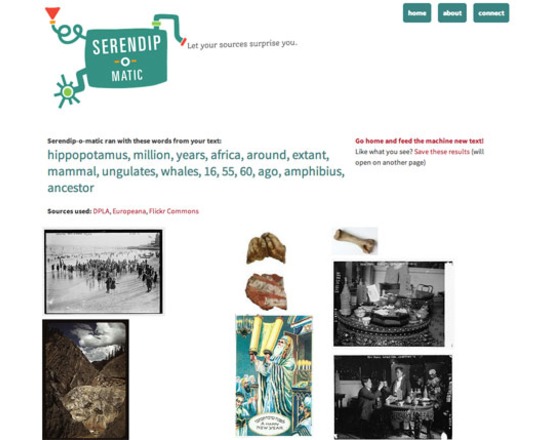
Serendip-o-matic extracts keywords from your Zotero library or from text that you've pasted into the web interface, and finds related content in locations such as the Digital Public Library of America (DPLA), Europeana, and Flickr Commons, including photographs, documents, maps and other primary sources.
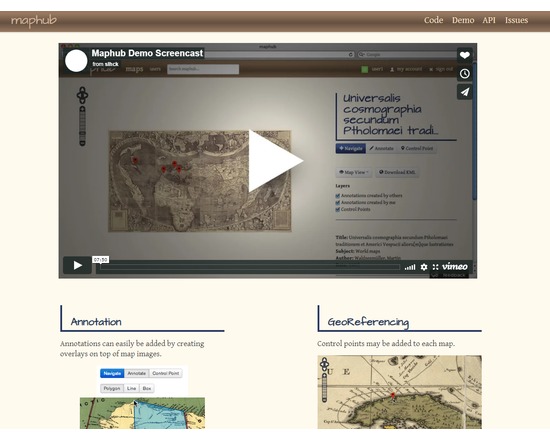
Maphub is a web portal for georeferencing and annotating digitized historic maps. Georeferencing transforms the map image to align with real world geographic coordinates, while the annotations are overlaps plus notes. Maphub suggests possible tags for the annotation based on its text and location; tags link to related Wikipedia articles. Once created, user-contributed annotations are shared via the Maphub Open Annotation API.
A first prototype of Maphub, using digitized maps from the Library of Congress’ Map Division, can be found at http://maphub.herokuapp.com/.