Kartograph
- Last Updated: 10/5/2018 12:00:00 AM
- Site: http://kartograph.org/
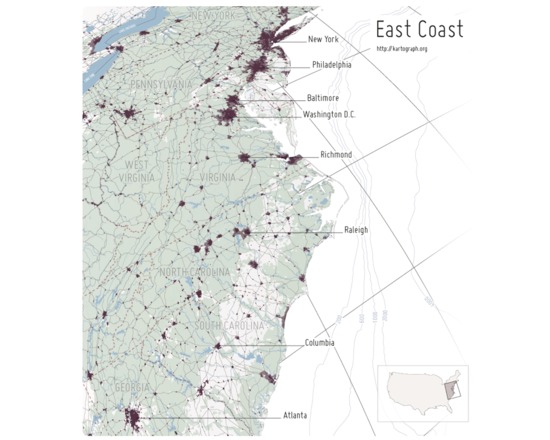
Kartograph is a pair of free and open source libraries for representing data with a spatial component on webpages or in print. The first library, Kartograph.py, is a Python library that builds lightweight vector graphic maps from either shapefiles or PostGIS tables. These graphics files can be styled either using a cascading style sheet during creation or later on the second library, Kartograph.js. The vector files can also be edited and enhanced in a vector graphics program like Adobe Illustrator.
Kartograph.js allows the user to create interactive maps for web pages and web applications, using vector graphics files and data files to both draw the basemap and the features of interest. Unlike many web-based mapping libraries, Kartograph.js requires no server or even internet connection. All of the pertinent information is in the vector and data files. The results are highly customizable and can absolutely arresting, visually.
- Type of analysis: Visualization
- Type of license: Free Open Source
- Web Usable: Other
- Warning: Beta
- TaDiRAH Methods: Contextualizing Network Analysis Spatial Analysis Visualization
Comments