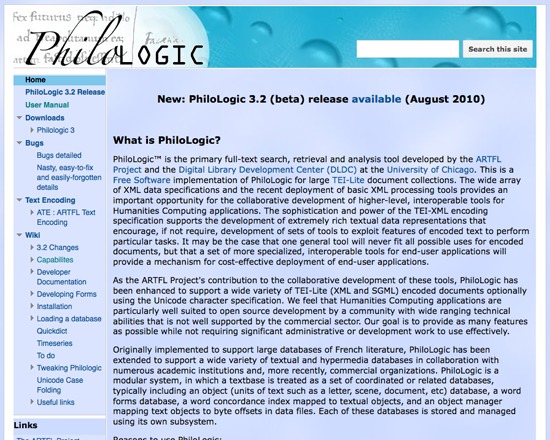
Philologic is a free, open source full-text search, retrieval and analysis tool developed by the ARTFL Project and the Digital Library Development Centre, at the University of Chicago. This tool supports a wide variety of XML and SGML encoded documents, in addition to plain text, Dublin Core and HTML, and includes a MySQL back end. It is designed ot be light, fast and robust, boasts extensive use and testing, and can be used directly 'out of the box' with numerous configuration options built in.
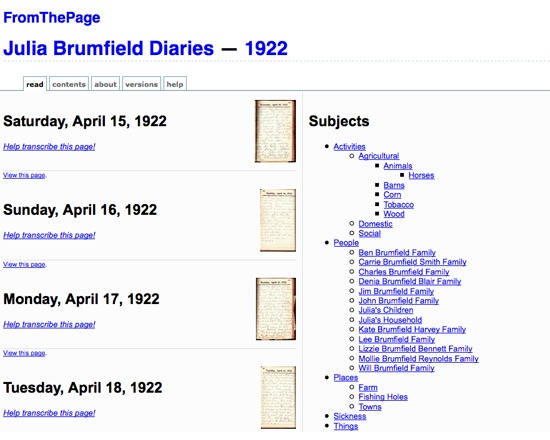
FromThePage is a free software for manuscript transcription, allowing volunteers to transcribe document pages online. Transcriptions can then be marked up and annotated in a wiki-like enviroment, with the resultant text displayed on the public web. It includes a discussion environment, enabling collaboration on particularly difficult pages. FromThePage is currently in beta, permitting up to 100 pages per project, and is in the process of developing a paid version for larger projects requiring more server space, with price determined primarily by server and maintenance costs. Privacy features are also under development, and further features forthcoming based on feedback from users.
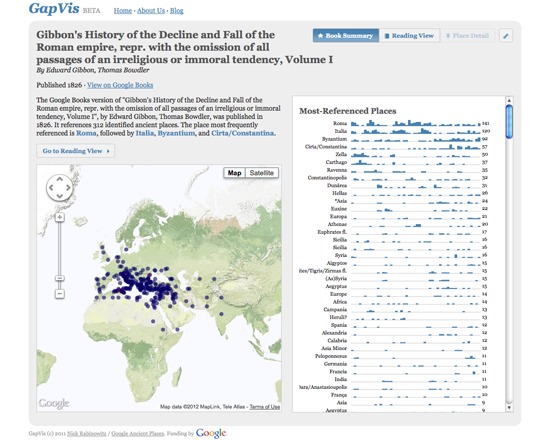
GapVis is a free tool developed in conjunction with Google Ancient Places to visualize the locations within and allow the exploration of books referencing ancient places within the Google Books collection. Users can view text summaries, use an enhanced reading interface and explore the location references through a place detail view. It is intended both to enable location-based text discovery, and to allow users to delve more deeply into a text based on the locations referenced within it. GapVis is currently in beta.
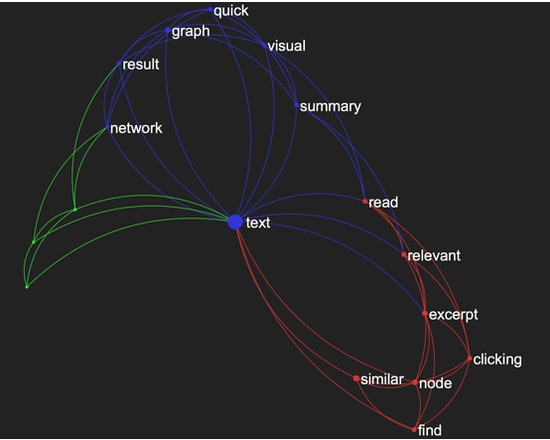
Textexture is a free, web-based tool for visualizing texts as a network. The visualization gives a quick visual summary of the text. Clicking on nodes brings up the excerpts the tool has identified as most relivant, and permits users to locate similar texts. Users can upload their own text, or visualize texts from Textexture's library of public texts.
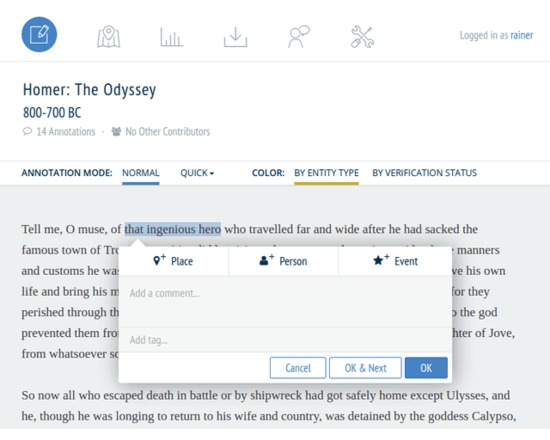
Recogito is an online platform for collaborative document annotation.
Recogito provides a personal workspace where you can upload, collect and organize your source materials - texts and images - and collaborate in their annotation and interpretation. Recogito enables you to make your work more visible on the Web more easily, and to expose the results of your research as Open Data.
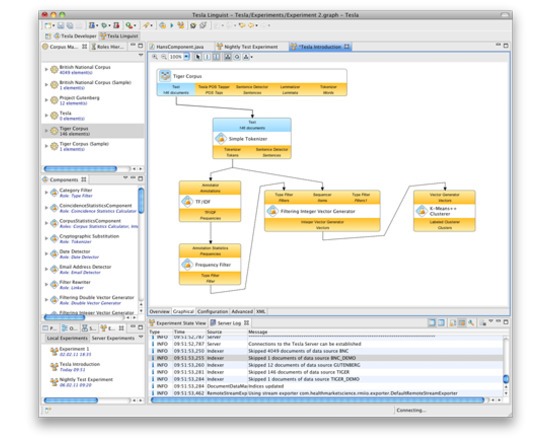
Tesla is a virtual research environment for text engineering - a framework you can use to create experiments in corpus linguistics, and to develop new algorithms for natural language processing. Tesla is a client-server application, which can be used by individual researchers as well as by workgroups. The screenshot below shows the experiment editor of Tesla's Client application.
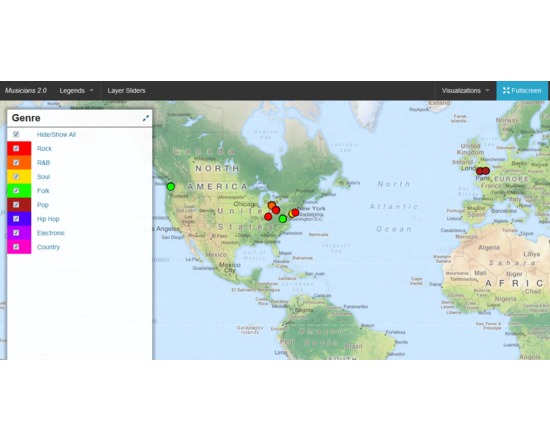
DH Press (originally called diPH) is a toolkit conceived as an easy-to-use WordPress plugin which allows potentially every kind of user to visualise and mashup historic and geographic information, documents and various types of multimedia content to develop digital humanities project.
The user cannot start from the toolkit itself, as the first step to set up a project, when the toolkit is already installed, is a CSV import. This means that the raw information has to be processed first, through any software like Microsoft Excel or Google Spreadsheet, following some conventions dictated by the toolkit, and once completed must be exported in CSV format. The file can then be imported into DH Press.
At this point, the user finally has full control over the data. First, the toolkit needs to be informed of what kind of data is in each column, as it can handle various types, such as Short Text, Long Text, Lat/Lon, Date, and Link. The steepest learning curve resides here, in the data management part, as the database must be set up very carefully, and fixing any problem later is complex. This does not mean that new users cannot approach the tool, but some basic research on data management is required to make correct use of it.
After setting up all this fields, called “motes” in the toolkit, a legend can be assigned to each of them, for example a field called “city” might contain, through multiple entries, ten different cities, and to each of those will correspond the colour chosen by the user. It is also possible to assign icons or png images instead of colours.
A single control panel then allows the user to create, set up and manage multiple visualisations of different kind, and in each of them the user can choose which information to display and how. This part is the most useful and is really straightforward.
The last section of the control panel lets the user set up custom fields for data and run a test of the whole project, and outputs detailed error information.
Following the training page, http://dhpress.org/training/, it is possible to take advantage of a pre-existing database, which can be used to quickly set up a project, so that one can instantly work on the main control panel. There is a detailed google document that guides the user through the process step by step, and also offers an even more detailed annex. A couple of hours is enough to go through all of it and get the necessary information to use it correctly. Then, any view can be quickly set up and customised in any desired way.
Overall, this toolkit is quite stable, reliable, user-friendly after the first entry barrier and gives you a varied set of tools to visualise and display a large amount of data in a neat, organised manner.
For a more detailed and personal review, please read http://claudiasartori.com/2015/01/tool-review-dh-press/
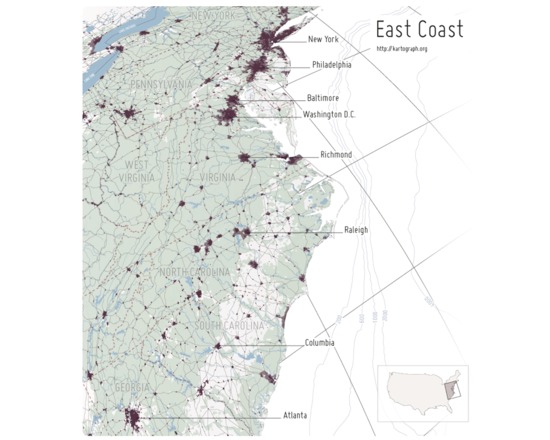
Kartograph is a pair of free and open source libraries for representing data with a spatial component on webpages or in print. The first library, Kartograph.py, is a Python library that builds lightweight vector graphic maps from either shapefiles or PostGIS tables. These graphics files can be styled either using a cascading style sheet during creation or later on the second library, Kartograph.js. The vector files can also be edited and enhanced in a vector graphics program like Adobe Illustrator.
Kartograph.js allows the user to create interactive maps for web pages and web applications, using vector graphics files and data files to both draw the basemap and the features of interest. Unlike many web-based mapping libraries, Kartograph.js requires no server or even internet connection. All of the pertinent information is in the vector and data files. The results are highly customizable and can absolutely arresting, visually.
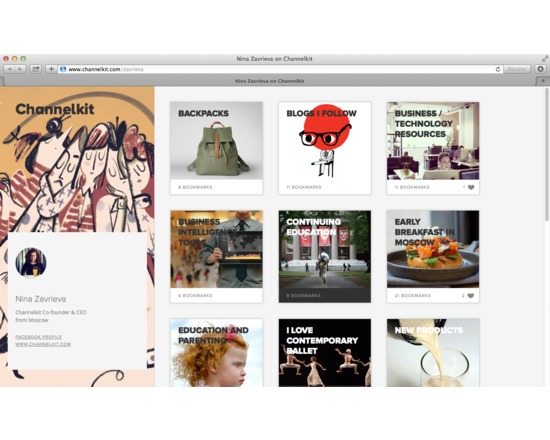
Channelkit lets you save, organize and share links to websites, articles, places, videos and anything else you might need on the web and discover content curated by others.
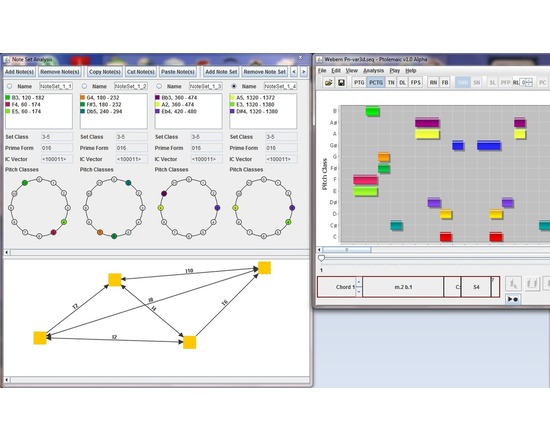
Ptolemaic is a computer application for music visualization and analysis written in the Java programming language. The software is designed to aid in the analysis of all types of Western music using established analytical techniques, including tonal functional analysis (Harrison 1994), pitch-class set analysis (Forte 1973), hierarchical linear analysis (Schenker 1935, Jones 2002), tonal pitch-space analysis on the Tonnetz (Riemann 1915), pitch-class set analysis (Forte 1973), and transformation analysis (Lewin 1987). Musical works and excerpts may be opened and saved using the de-facto standard music notation interchange format, MusicXML. To assist in analysis, Ptolemaic can display the music on a pitch/time graph, on a pitch-class/time graph, on a step-class/time graph (also called a diatonic lattice) (Jones 2002), on the Tonnetz, or using filtered point-symmetry (Douthett 2008). Pitch classes and chords are color coded so that the user can easily correlate them across each graph. The benefit of having a software tool to visualize and perform certain analysis tasks is in automating processes that are normally time-consuming for the musician, thus allowing the music scholar to focus on the musical issues, rather than the technical issues of graphing, and calculating chord classes. Ptolemaic provides useful ways of visualizing a piece of music and tools for gaining more information about that music, so that the user can efficiently make informed musical decisions about the music and preserve that analysis for future study.