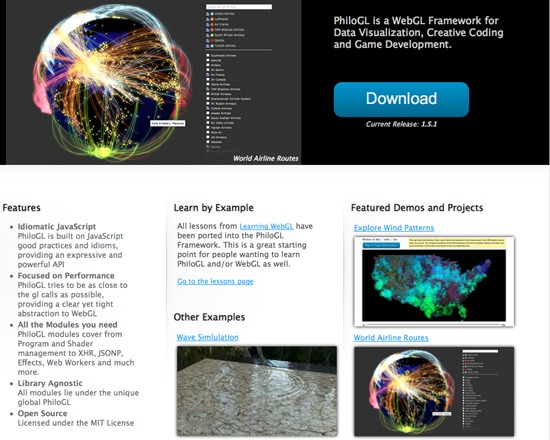
PhiloGL is an open source WebGL Framework for advanced data visualization, creative coding and game development. It includes a module system encompassing Program and Shader management, IO, XHR, JSONP, Web Worker management, Effects and Tweening, among others.
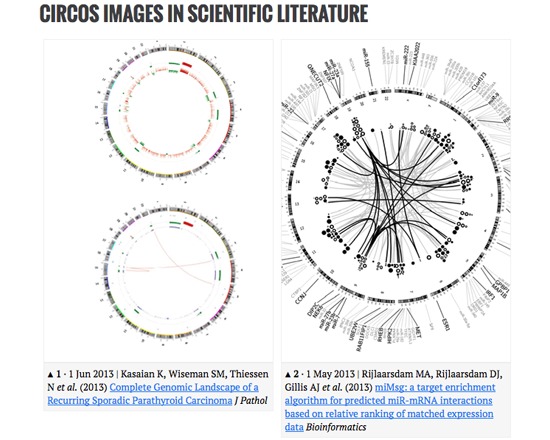
Circos is a free visualization tool for creating publication-quality infographics and illustrations. Its visualizations are arranged in a circle to facilitate exploring relationships between objects and positions, which also has the benefit of offering a high data-to-ink ratio. Though promoted for the sciences, it is highly flexible and can visualize datasets from a wide variety of fields.
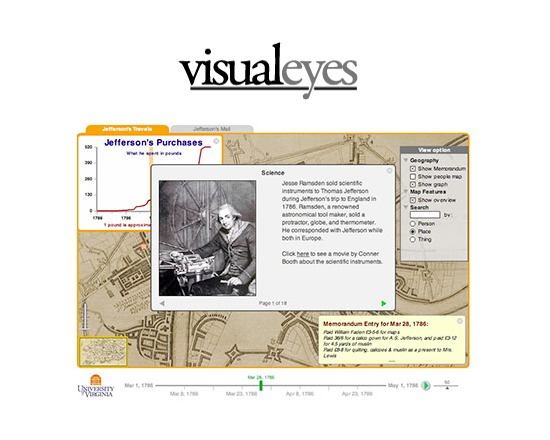
VisualEyes is web-based authoring tool for creating dynamic visualizations offered by the University of Virginia. It can be used to combine images, maps, charts, video and research data into a single visualization. It is comprehensively documented, including a reference guide to its XML structure and scripting, and to structuring data for inclusion.
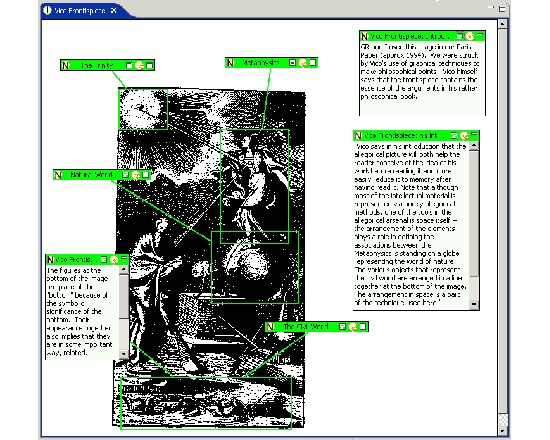
Pliny was a tool for working with annotations when conducting personal scholarly research, and can be used with both digital and print materials. It also had data manangement and organizational features, and was designed to facilitate reading, reacting to that reading and forming an interpretation. Pliny stored all data on the user's computer rather than remotely on the web.
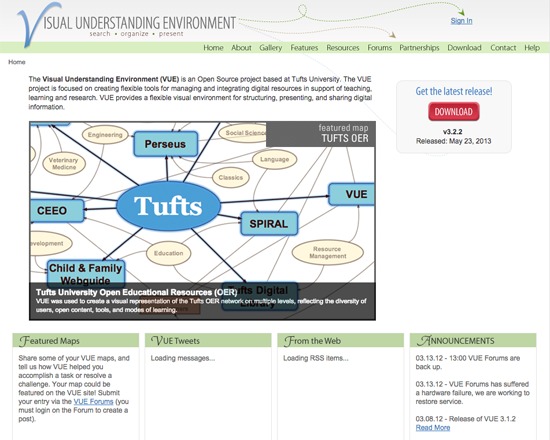
Visual Understanding Environment (VUE) is a free, open source application for mapping concepts, ideas and digital content. It enables users to generate nodes and links, and apply a simple set of tools to explore the relationships. VUE is, in the words of its developers, an application to "integrate, organize and contextualize electronic content" in research or learning environments. Its tools include visualization, dynamic content mapping, semantic mapping, enhanced pathways and search functions.
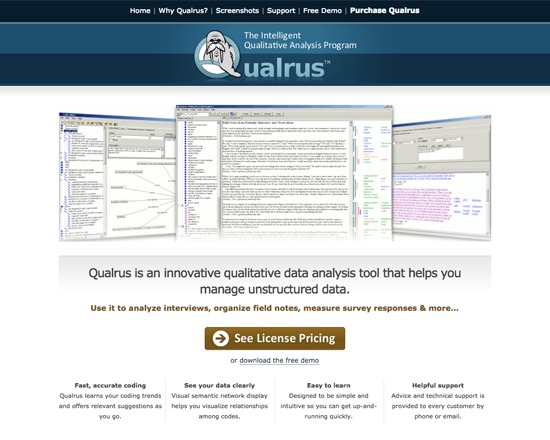
Qualrus is a commercial application for qualitative data analysis, including data coding and statistics functions. It can analyze data from a wide variety of sources, including common text, web, image, video and audio files. The data coding functions are supplemented by machine learning processes to assist data processing and analysis. In terms of analysis, it offers a number of common text analysis functions including tokenization, co-occurences, and Boolean search, and can visualize a network view of interrelationships. It is particularly aimed at academic and institutional applications, and both student and free trial versions are avaiable.
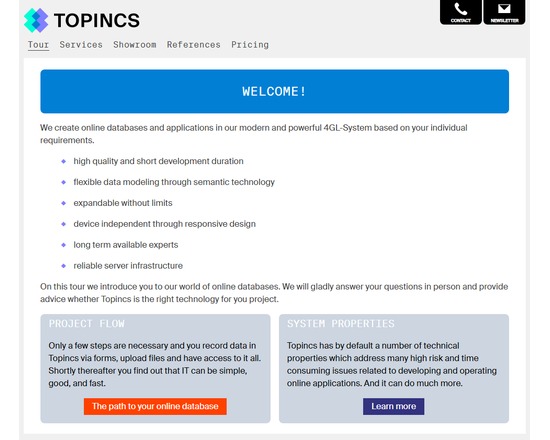
Topincs is a online database software. Given a data model, it allows data to be recorded and files to be uploaded and annotated through forms, data and files to be displayed and navigated through interconnected data sheets, and all that searched in the index. It overcomes the rigidity of relational databases by using semantic technology. In the simplest use case, a group of users can collaboratively edit information and upload files from any device with a web browser and an internet connection. Development time ranges between 1 and 8 hours.
By designing and implementing services, the data can be manipulated, transformed and aggregated through an virtual object oriented programming interface driven by the data model. This allows sophisticated use cases where different user groups with different rights are presented a completely different application working on the same database. In these cases development time ranges between 2 and 20 days.
A Topincs online database can be rented for a monthly fee. Topincs provide all services related to an online database: data modeling, programming, and support. They have special rates for educational institutions. Topincs can also be used as a Platform as a Service where the dark art of Topincs modeling and development must be studied online. The underlying semantic technology, Topic Maps, is taught there through hands on examples and will change your view on information technology.
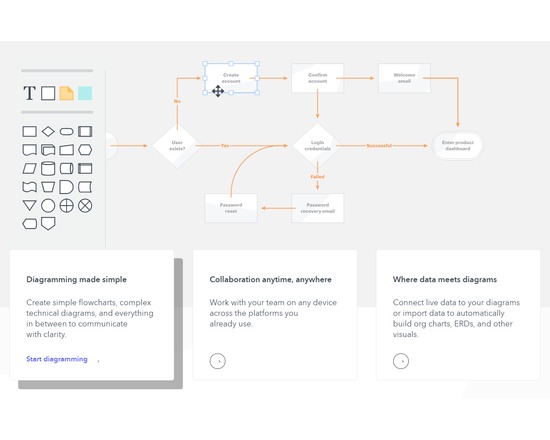
Lucidchart is an online diagram tool that enables users to easily visualize complex information through flow charts, mind maps and other diagram types. Multiple users can work together simultaneously to edit a document. Lucidchart integrates with many platforms including Google Apps/Drive, Confluence, JIRA, Slack, ec. Free accounts are provided for educational use.
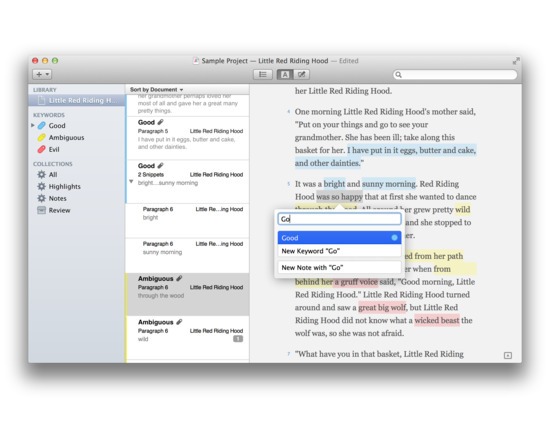
Annotating documents with highlights and notes can quickly clutter the page. Annotations simplifies adding and managing notes to texts while keeping the documents clear and readable.
Features
Highlight text with colours, assign custom keywords or add notes
Auto-completion to match existing keywords as you type
Organise and filter annotations by collections, type, keywords or matching search criteria
Create relationships between different annotations
Summary mode to view and export only what has been highlighted or provided with notes
Import support for plain text, rich text and Microsoft® Word documents
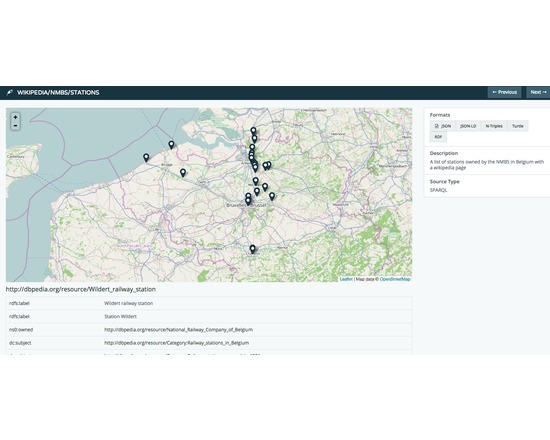
The DataTank is an open source tool that publishes data, stored in text-based files (e.g., CSV, XML, JSON) or in binary structures (e.g., SHP files, relational databases). The DataTank reads data from these structures and publishes them to the web using a URI as an identifier, providing these data in any format a user wants regardless of the original data structure. The DataTank requires a server with Apache2 or Nginx, mod rewrite enabled, PHP 5.4 or higher, Git, any database supported by Laravel 4.
Features
Turn any dataset into a RESTful HTTP API
Allows published data to be requested in any web-readable format or visualization
Improves the ease, openness, and transparency of data consumption
Enables data consumers to immediately begin working, without needing to download raw data files
Provides visualizations for immediate data interpretation and information gathering by civilians