Skip to content
TAPoR Text Analysis Portal for Research

Tools

Sort by Name Rating ↓ Date

Visualization

Voyant Cirrus

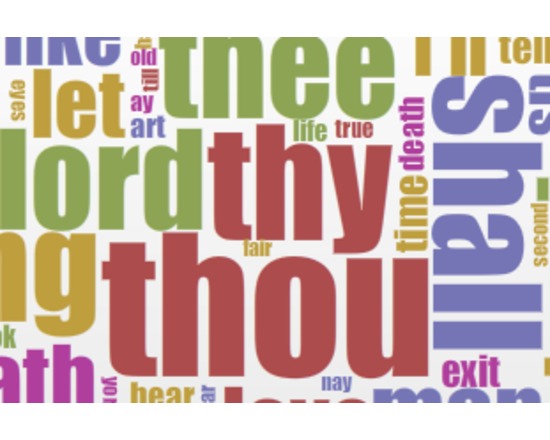
Cirrus is a visualization tool that displays a word cloud relating to the frequency of words appearing in one or more documents. One can click on any word appearing in the cloud to obtain detailed information about its relativity.

Rated 5.0 out of 5.

Visualization

Voyant Bubblelines

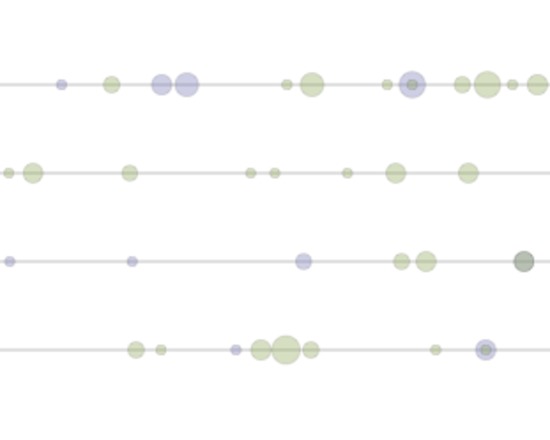
Bubblelines is a visualization tool that helps to understand patterns of word repetition in one or more documents. Each document is represented as a horizontal line and each seach term is represented as a bubble – the bubble represents the frequency of the term in the corresponding segment of text (the text is divided into segments of equal length).

Rated 5.0 out of 5.

Visualization

Voyant Bubbles

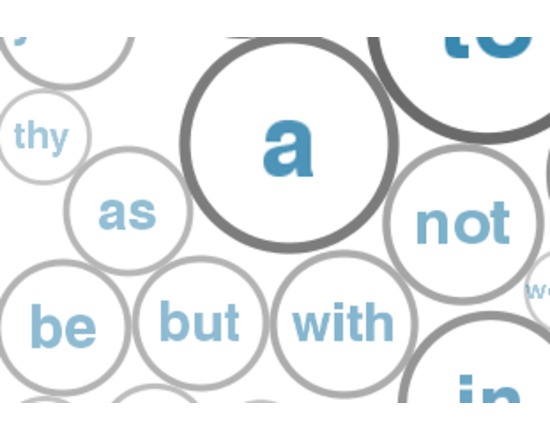
Bubbles reads the words in a document (or corpus) and displays the highest frequency words within proportionately large bubbles. Once you arrive to Bubbles, insert / upload your content and let the tool perform its analysis.

Rated 5.0 out of 5.

Visualization

Voyant Knots

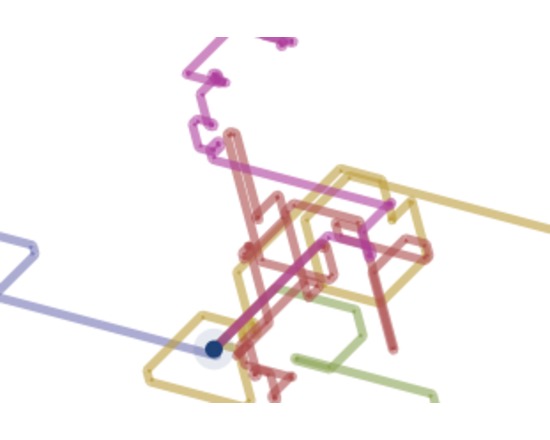
Knots is a visualization tool that helps to understand patterns of word relevance in one or more documents. Each term is represented as a twisted line – when the lines overlap it means a relevance or linkage within the terms.

Rated 5.0 out of 5.

Visualization

TextArc

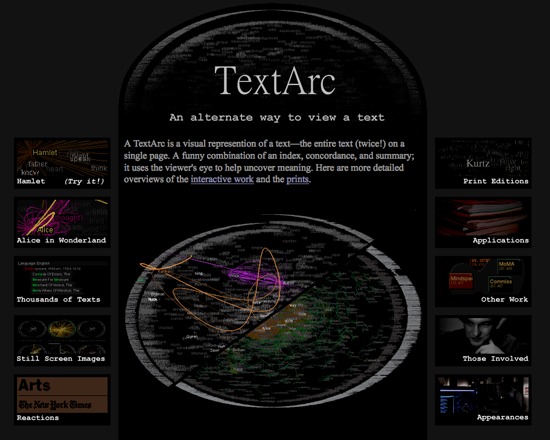
TextArc is a free visualization tool that represents an entire text on a single page. It has elements of an index, concordance and summary all in one place, encouraging the viewer to use its juxtapositions to uncover meaning. The web-based applet is preloaded with thousands of text collected from Project Gutenberg. Note: TextArc was designed for browsers circa 2002 and requires Java SE 6 to run.

Rated 5.0 out of 5.

Visualization

Gephi

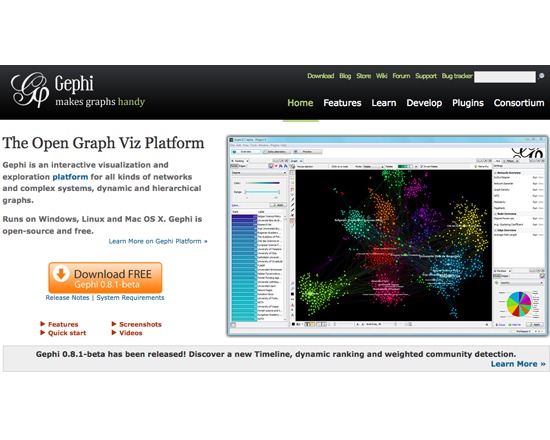
Gephi is a free, open source interactive visualization and data exploration tool. Users can manipulate the display to uncover new facets of the data, enabling intutive exploration.

Rated 5.0 out of 5.

Visualization

KH Coder

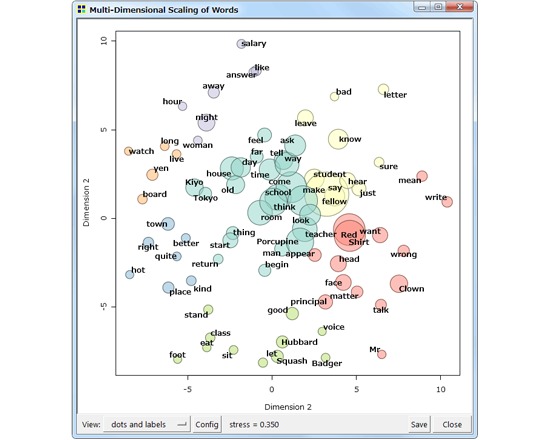
KH Coder is a tool for quantitative content analysis and text mining that has been under continuous development since 2001. It was originally developed for Japanese text and now supports numerous other languages, including English, Italian and French. KH Coder also has computational linguistics applications.

Rated 5.0 out of 5.

Visualization

NodeXL

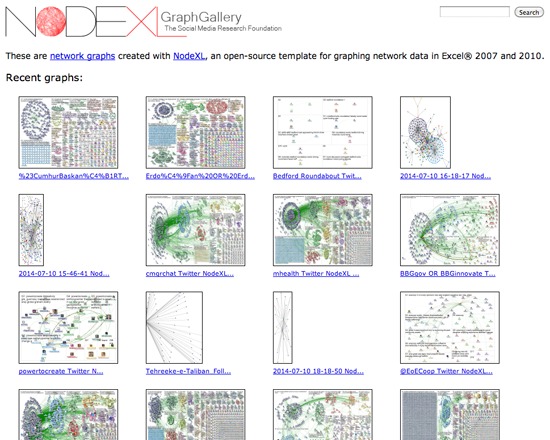
NodeXL is a free, open source tool for generating and exploring network graphs from Microsoft Excel files. It is particularly suited to data from social media sources, and includes the ability to directly import data from Twitter, YouTube, Flickr and email, with additional plugins available for gathering data from Facebook, Microsoft Exchange, wikis and URLs. The tool generates visualizations that can be adjusted, zoomed and filtered, with additional features for vertex grouping, graphing metric calculations, and automating tasks. NodeXL can both import and export data in GraphML, Pajek, UCINet and matrix formats.

Rated 5.0 out of 5.

Visualization

Textual Geography Analyzer

Parses text tagged by the Stanford named entity recognizer in order to collect and analyze mentions of locations. Also incorporates the Google API in order to geocode those locations and, ultimately, mark them on a map. This code was written in an IPython Notebook, so the code below is actually a collection of scattered code snippets. Please see the repository on github for full details and documentation, or the Methods Common recipe ( http://methodi.ca/recipes/mapping-locations-corpus ) for a step-by-step guide. NOTE: Users will be required to acquire their own Google API key, store it in a text file, and then point the code to that text file. Instructions can be found in the IPython Notebook itself. Search for "api_key_file" to find the line in code that needs to be changed.

Rated 5.0 out of 5.

Visualization

Heurist Data Manager / Visualiser / Publisher

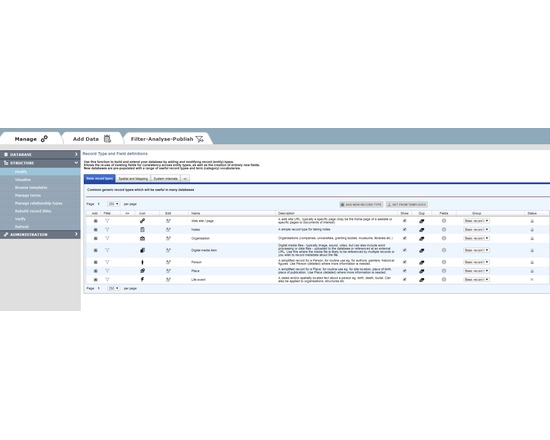
HEURIST (http://HeuristNetwork.org) is an extremely flexible, end-user oriented, web-based data management system designed specifically for Humanities data. Developed since 2005, it has been in active use across many projects since 2009. It is available both as a free web service for researchers (hosted at the University of Sydney Data Centre) or for installation on a physical or virtual server (Open Source on gitHub). Researchers can design, create, manage, analyse, visualise and publish their own richly-structured database(s) through a simple web interface, without the need for programmer(s). Quite complex databases can be built in a few hours by borrowing structures and vocabularies published by other users. Databases can be designed and built incrementally, as existing data are not affected by changes in structure. Databases created by Heurist are stored in MySQL with a repeatable structure facilitating sustainability and independent access by other software. Advanced features include record linking, graph structure, drill-down facet searches, rule-based queries, custom reports, linked map-timelines, network visualisation, normalised spreadsheet import, crosstabulation, XML feeds, XSLT transforms. The team provides initial email and skype assistance for project setup at no cost, and special customisations at modest cost. Heurist is applicable in many domains including History, Archaeology, Anthropology, Cultural Research, Linguistics, Media Studies etc. It handles everything from text, tags and categories, through networks of rich relationships and offset annotations, to images, video, spatial data and dating (including non-western systems and dating uncertainty). Sophisticated searches (including faceted and rule-based) can be saved, organised and rendered as layered interactive maps, timelines, network visualisations, crosstabulations, lists, custom reports, XML and XSLT transforms, all of which can easily be printed or embedded (live) in a website - Heurist provides the html code required to embed results in a web page or CMS. Databases can easily be migrated later to a personal or institutional server. Since the data are stored in a standard MySQL database with a fixed and well-documented structure, the data can be accessed directly via SQL from most programming languages independently of Heurist. Version 4.2 (Jan 2016 onwards) is available as a service via the Heurist website. Version 4 delivers a user-customisable interface of widgets, along with better mapping and visualisation. Existing version 3 databases are bidirectionally compatible with version 4.

Rated 5.0 out of 5.