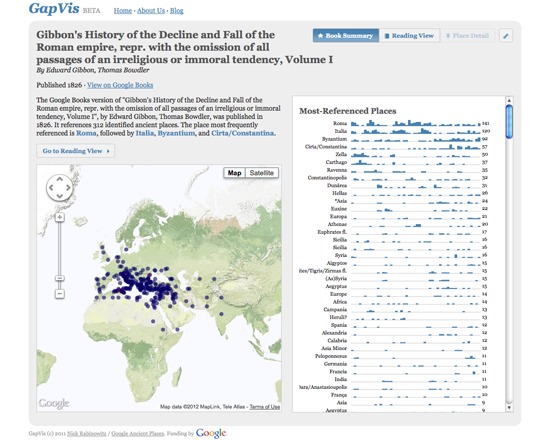
GapVis is a free tool developed in conjunction with Google Ancient Places to visualize the locations within and allow the exploration of books referencing ancient places within the Google Books collection. Users can view text summaries, use an enhanced reading interface and explore the location references through a place detail view. It is intended both to enable location-based text discovery, and to allow users to delve more deeply into a text based on the locations referenced within it. GapVis is currently in beta.
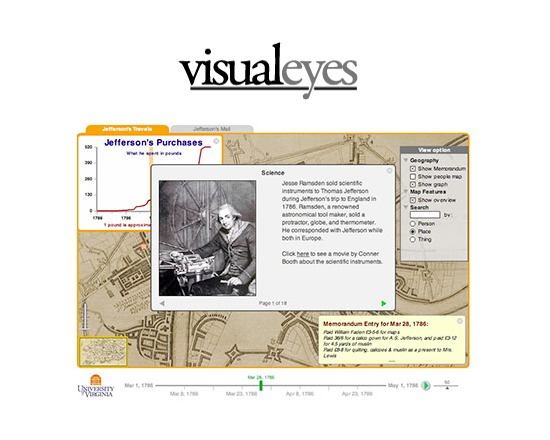
VisualEyes is web-based authoring tool for creating dynamic visualizations offered by the University of Virginia. It can be used to combine images, maps, charts, video and research data into a single visualization. It is comprehensively documented, including a reference guide to its XML structure and scripting, and to structuring data for inclusion.
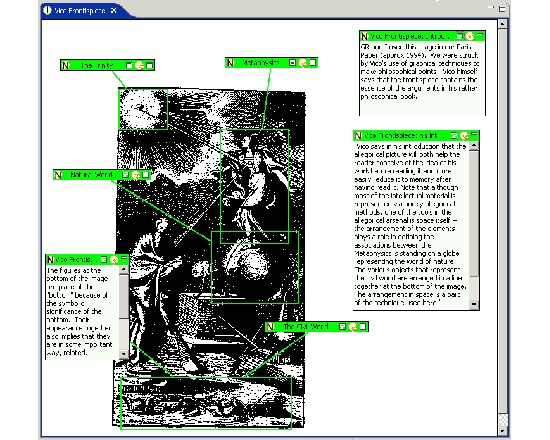
Pliny was a tool for working with annotations when conducting personal scholarly research, and can be used with both digital and print materials. It also had data manangement and organizational features, and was designed to facilitate reading, reacting to that reading and forming an interpretation. Pliny stored all data on the user's computer rather than remotely on the web.
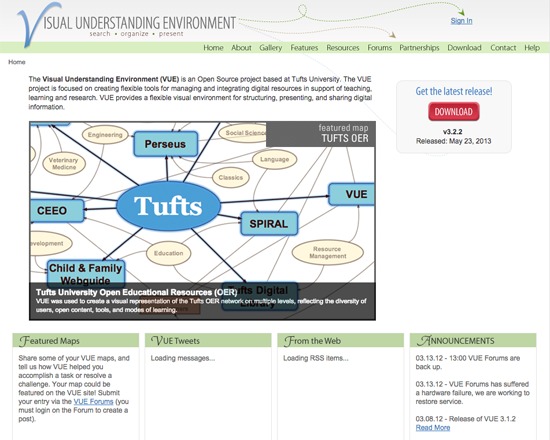
Visual Understanding Environment (VUE) is a free, open source application for mapping concepts, ideas and digital content. It enables users to generate nodes and links, and apply a simple set of tools to explore the relationships. VUE is, in the words of its developers, an application to "integrate, organize and contextualize electronic content" in research or learning environments. Its tools include visualization, dynamic content mapping, semantic mapping, enhanced pathways and search functions.
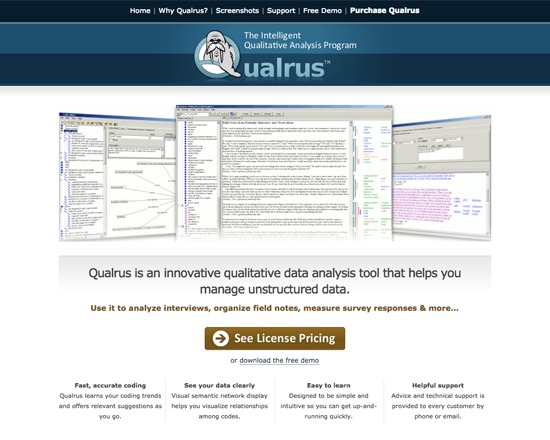
Qualrus is a commercial application for qualitative data analysis, including data coding and statistics functions. It can analyze data from a wide variety of sources, including common text, web, image, video and audio files. The data coding functions are supplemented by machine learning processes to assist data processing and analysis. In terms of analysis, it offers a number of common text analysis functions including tokenization, co-occurences, and Boolean search, and can visualize a network view of interrelationships. It is particularly aimed at academic and institutional applications, and both student and free trial versions are avaiable.
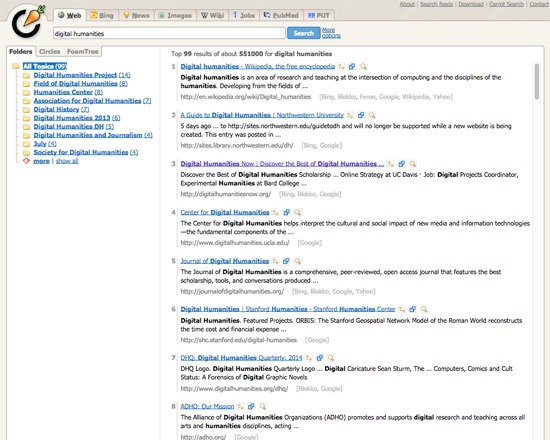
Carrot2 is a free, open source search clustering engine with additional document categorization functions. For each set of search terms, Carrot2 provides a topic tree and subtopics built from the search results, and generates visualizations that enable users to quickly overview their search. Searches can be filtered according to source, such as Bing, image files or the Wikipedia, results can be clustered according to several presets such as K-means or URL, or filtered by country and langauge. Carrot2 enables users to download results in ranges from 50 to 200 for further analysis.
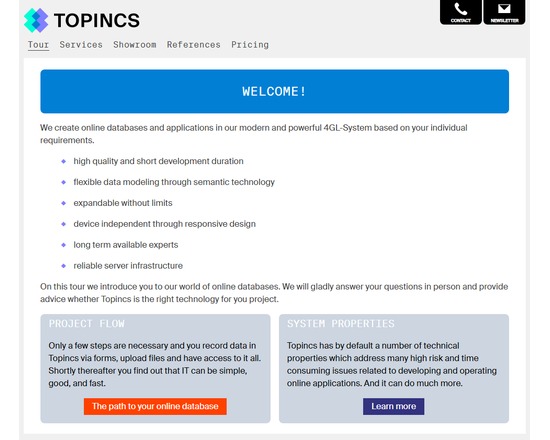
By designing and implementing services, the data can be manipulated, transformed and aggregated through an virtual object oriented programming interface driven by the data model. This allows sophisticated use cases where different user groups with different rights are presented a completely different application working on the same database. In these cases development time ranges between 2 and 20 days.
A Topincs online database can be rented for a monthly fee. Topincs provide all services related to an online database: data modeling, programming, and support. They have special rates for educational institutions. Topincs can also be used as a Platform as a Service where the dark art of Topincs modeling and development must be studied online. The underlying semantic technology, Topic Maps, is taught there through hands on examples and will change your view on information technology.
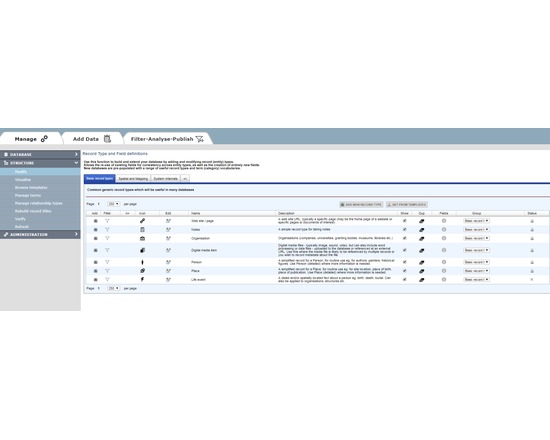
HEURIST (http://HeuristNetwork.org) is an extremely flexible, end-user oriented, web-based data management system designed specifically for Humanities data. Developed since 2005, it has been in active use across many projects since 2009. It is available both as a free web service for researchers (hosted at the University of Sydney Data Centre) or for installation on a physical or virtual server (Open Source on gitHub).
Researchers can design, create, manage, analyse, visualise and publish their own richly-structured database(s) through a simple web interface, without the need for programmer(s). Quite complex databases can be built in a few hours by borrowing structures and vocabularies published by other users. Databases can be designed and built incrementally, as existing data are not affected by changes in structure. Databases created by Heurist are stored in MySQL with a repeatable structure facilitating sustainability and independent access by other software.
Advanced features include record linking, graph structure, drill-down facet searches, rule-based queries, custom reports, linked map-timelines, network visualisation, normalised spreadsheet import, crosstabulation, XML feeds, XSLT transforms. The team provides initial email and skype assistance for project setup at no cost, and special customisations at modest cost.
Heurist is applicable in many domains including History, Archaeology, Anthropology, Cultural Research, Linguistics, Media Studies etc. It handles everything from text, tags and categories, through networks of rich relationships and offset annotations, to images, video, spatial data and dating (including non-western systems and dating uncertainty).
Sophisticated searches (including faceted and rule-based) can be saved, organised and rendered as layered interactive maps, timelines, network visualisations, crosstabulations, lists, custom reports, XML and XSLT transforms, all of which can easily be printed or embedded (live) in a website - Heurist provides the html code required to embed results in a web page or CMS.
Databases can easily be migrated later to a personal or institutional server. Since the data are stored in a standard MySQL database with a fixed and well-documented structure, the data can be accessed directly via SQL from most programming languages independently of Heurist.
Version 4.2 (Jan 2016 onwards) is available as a service via the Heurist website. Version 4 delivers a user-customisable interface of widgets, along with better mapping and visualisation. Existing version 3 databases are bidirectionally compatible with version 4.
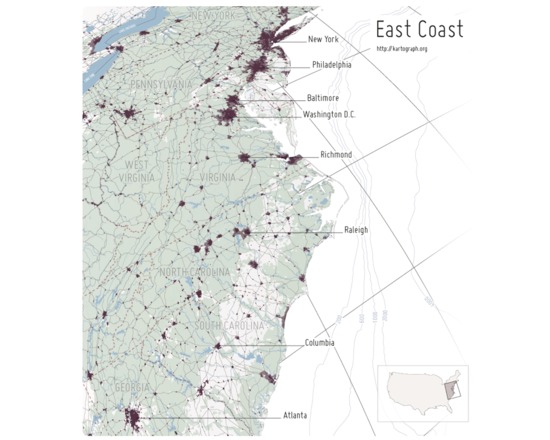
Kartograph is a pair of free and open source libraries for representing data with a spatial component on webpages or in print. The first library, Kartograph.py, is a Python library that builds lightweight vector graphic maps from either shapefiles or PostGIS tables. These graphics files can be styled either using a cascading style sheet during creation or later on the second library, Kartograph.js. The vector files can also be edited and enhanced in a vector graphics program like Adobe Illustrator.
Kartograph.js allows the user to create interactive maps for web pages and web applications, using vector graphics files and data files to both draw the basemap and the features of interest. Unlike many web-based mapping libraries, Kartograph.js requires no server or even internet connection. All of the pertinent information is in the vector and data files. The results are highly customizable and can absolutely arresting, visually.